Single-Cell Pairing Graph Analysis#
This notebook builds clonotype pairing graphs for four 10x samples and compares three stages: raw parsed tables, imputed missing-chain tables, and cleaned tables.
[1]:
# Shared imports and runtime helper.
import importlib
import sys
import time
from pathlib import Path

import igraph as ig
import matplotlib.pyplot as plt
import polars as pl

repo_root = (Path.cwd() / "..").resolve()
if str(repo_root) not in sys.path:
    sys.path.insert(0, str(repo_root))

from mir.common.single_cell import build_tenx_sample_from_cell_clonotypes, load_10x_vdj_v1_sample
from mir.common.single_cell_parser import load_10x_vdj_v1_cell_clonotypes
import mir.common.single_cell_repair as single_cell_repair
from mir.graph.single_cell_pairing import build_pairing_graph

single_cell_repair = importlib.reload(single_cell_repair)
cleanup_cell_clonotypes = single_cell_repair.cleanup_cell_clonotypes
impute_missing_chains = single_cell_repair.impute_missing_chains

SEED = 42


def run_step(name, fn, *args, **kwargs):
    # Keep per-step timing visible for long-running sample loops.
    t0 = time.perf_counter()
    result = fn(*args, **kwargs)
    dt = time.perf_counter() - t0
    print(f"{name}: {dt:.2f}s")
    return result

print(f"cwd: {Path.cwd()}")
print(f"repo_root: {repo_root}")
print(f"seed: {SEED}")
/Users/mikesh/vcs/mirpy/.venv/lib/python3.12/site-packages/tqdm/auto.py:21: TqdmWarning: IProgress not found. Please update jupyter and ipywidgets. See https://ipywidgets.readthedocs.io/en/stable/user_install.html
  from .autonotebook import tqdm as notebook_tqdm
cwd: /Users/mikesh/vcs/mirpy/notebooks
repo_root: /Users/mikesh/vcs/mirpy
seed: 42
Load Sample Inputs#
Discover sample annotation file pairs and preview parsed rows.
[2]:
# Resolve sample input files and validate the parsed schema.
cwd = Path.cwd()
repo_root = cwd if (cwd / "mir").exists() else cwd.parent
base = repo_root / "notebooks" / "assets" / "large" / "airr_benchmark" / "dcode"

pairs = []
for all_contig in sorted(base.glob("*_all_contig_annotations.csv.gz")):
    consensus = base / all_contig.name.replace("_all_contig_annotations", "_consensus_annotations")
    if consensus.exists():
        sample_id = all_contig.name.split("_all_contig_annotations")[0]
        pairs.append((sample_id, consensus, all_contig))

print(f"samples found: {len(pairs)}")
for sample_id, _, _ in pairs[:4]:
    print(" -", sample_id)

if not pairs:
    raise RuntimeError(f"No sample pairs found under {base}")

first = pairs[0]
first_df = run_step(
    "load_cell_table_preview",
    load_10x_vdj_v1_cell_clonotypes,
    first[1],
    first[2],
    sample_id=first[0],
)
print(first_df.select(["barcode", "raw_pair_id", "sequence_id", "locus"]).head(5))
samples found: 4
 - vdj_v1_hs_aggregated_donor1
 - vdj_v1_hs_aggregated_donor2
 - vdj_v1_hs_aggregated_donor3
 - vdj_v1_hs_aggregated_donor4
load_cell_table_preview: 0.59s
shape: (5, 4)
┌─────────────────────┬───────────────┬───────────────────────────┬───────┐
│ barcode             ┆ raw_pair_id   ┆ sequence_id               ┆ locus │
│ ---                 ┆ ---           ┆ ---                       ┆ ---   │
│ str                 ┆ str           ┆ str                       ┆ str   │
╞═════════════════════╪═══════════════╪═══════════════════════════╪═══════╡
│ AAACCTGAGACAAAGG-4  ┆ clonotype19   ┆ clonotype19_consensus_1   ┆ TRB   │
│ AAACCTGAGACAAAGG-4  ┆ clonotype19   ┆ clonotype19_consensus_2   ┆ TRA   │
│ AAACCTGAGACAAAGG-4  ┆ clonotype19   ┆ clonotype19_consensus_3   ┆ TRA   │
│ AAACCTGAGACTGTAA-34 ┆ clonotype1318 ┆ clonotype1318_consensus_1 ┆ TRB   │
│ AAACCTGAGAGCCCAA-5  ┆ clonotype1319 ┆ clonotype1319_consensus_2 ┆ TRA   │
└─────────────────────┴───────────────┴───────────────────────────┴───────┘
Parser vs Loader Consistency#
Validate parser-first assembly and direct loader produce matching counts.
[3]:
# Build sample object from parsed table and compare to direct loader shape.
sample_id, cp, ap = pairs[0]
cell_table = run_step(
    "parse_cell_table",
    load_10x_vdj_v1_cell_clonotypes,
    cp,
    ap,
    sample_id=sample_id,
)
parsed_sample = build_tenx_sample_from_cell_clonotypes(cell_table, sample_id=sample_id)
direct_sample = run_step("direct_loader", load_10x_vdj_v1_sample, cp, ap, sample_id=sample_id)

print("parsed sample cells:", parsed_sample.loaded_cell_count)
print("direct sample cells:", direct_sample.loaded_cell_count)
print("parsed sample clonotypes:", parsed_sample.loaded_clonotype_count)
print("direct sample clonotypes:", direct_sample.loaded_clonotype_count)
parse_cell_table: 0.55s
direct_loader: 1.42s
parsed sample cells: 47271
direct sample cells: 47271
parsed sample clonotypes: 61298
direct sample clonotypes: 61298
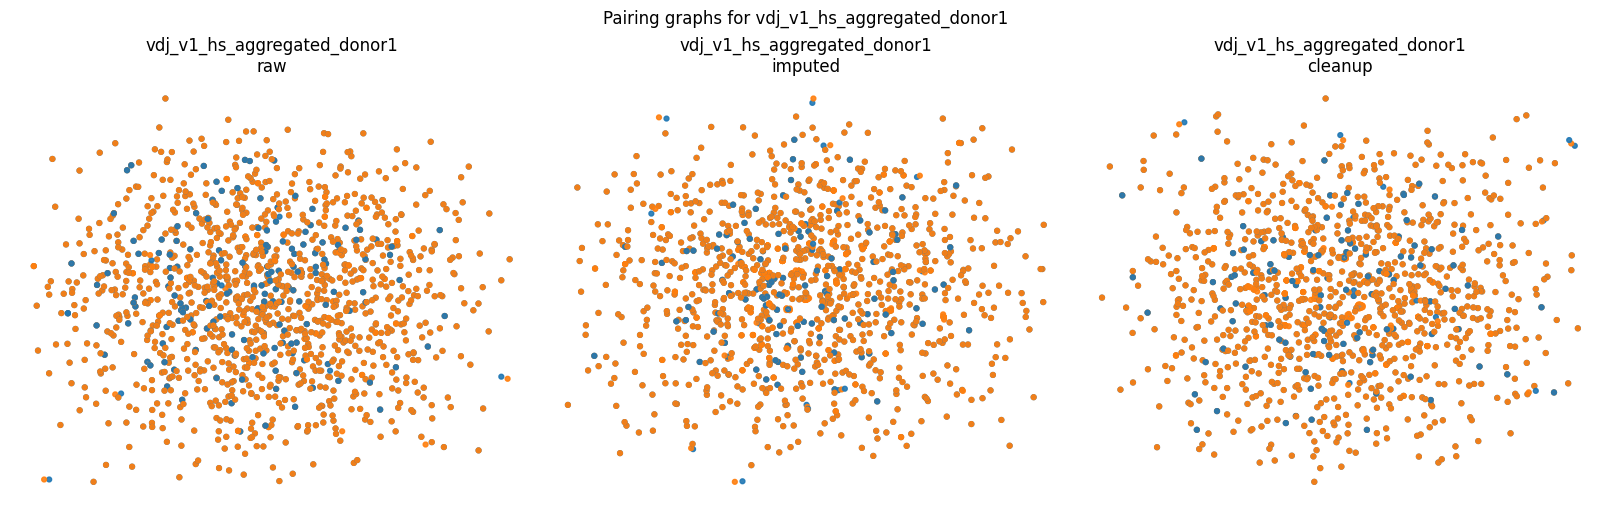
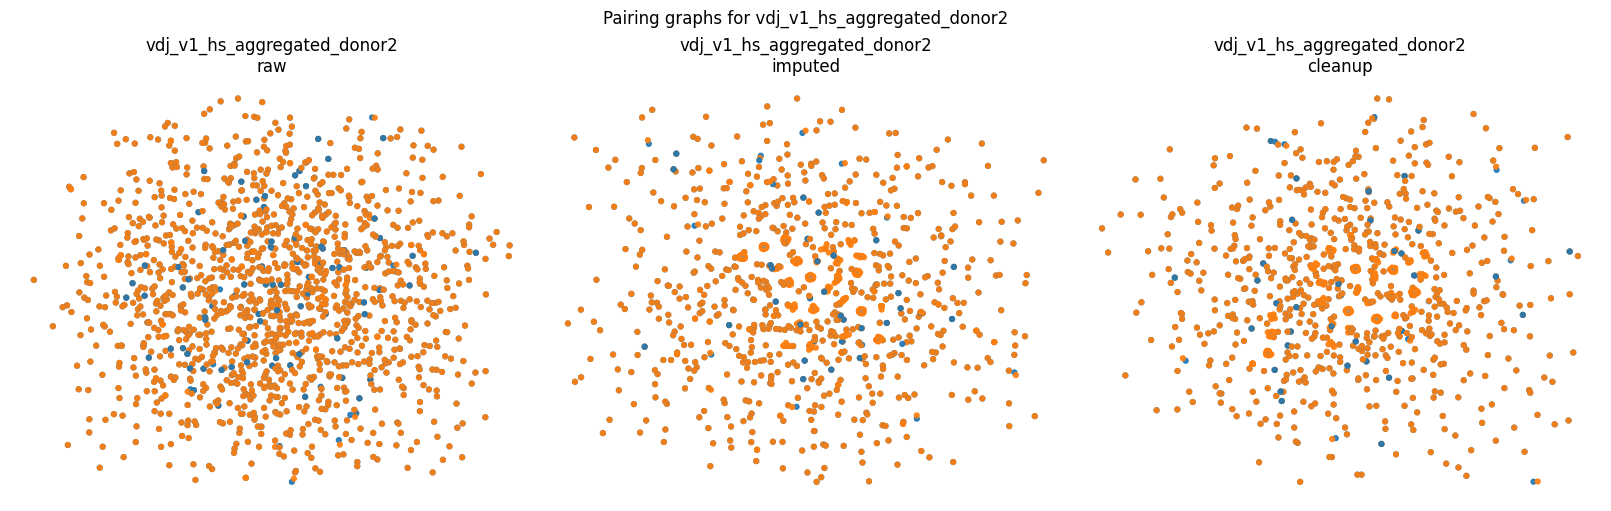
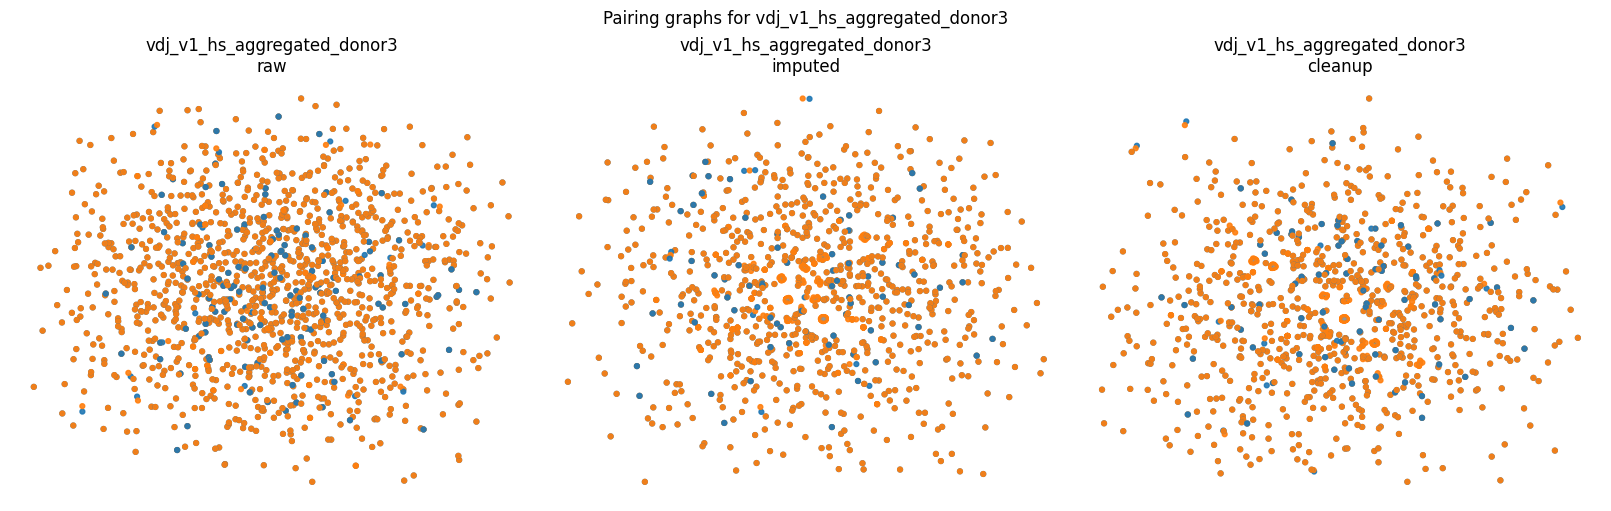
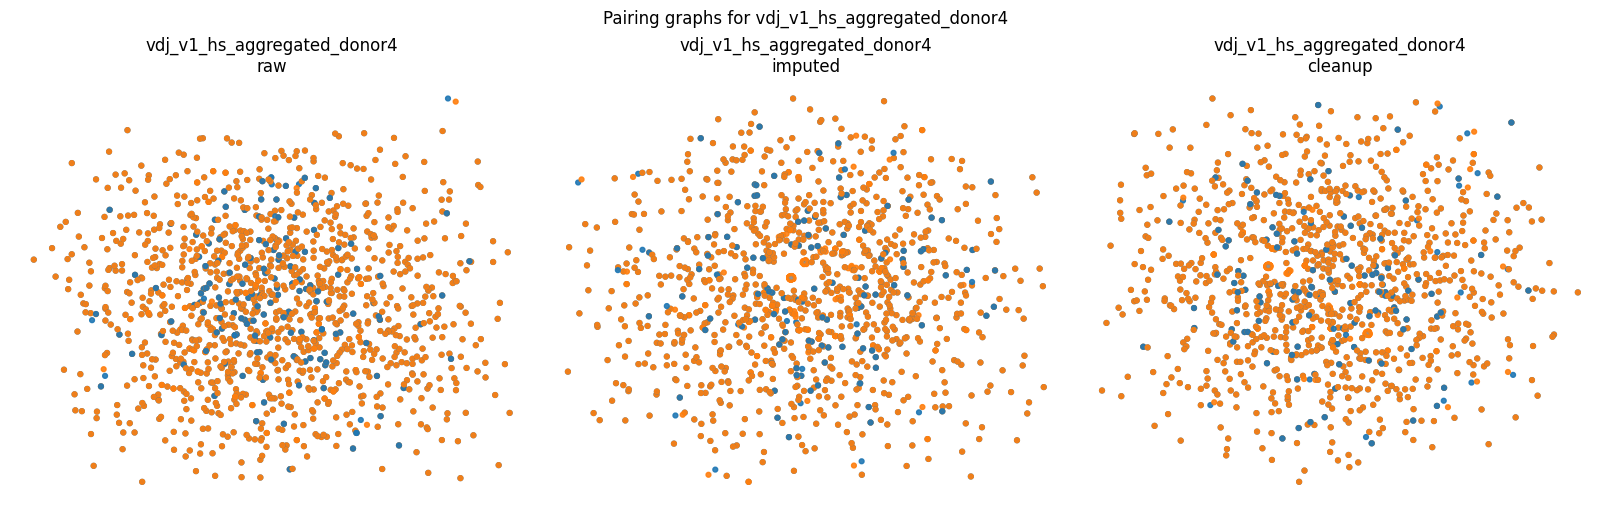
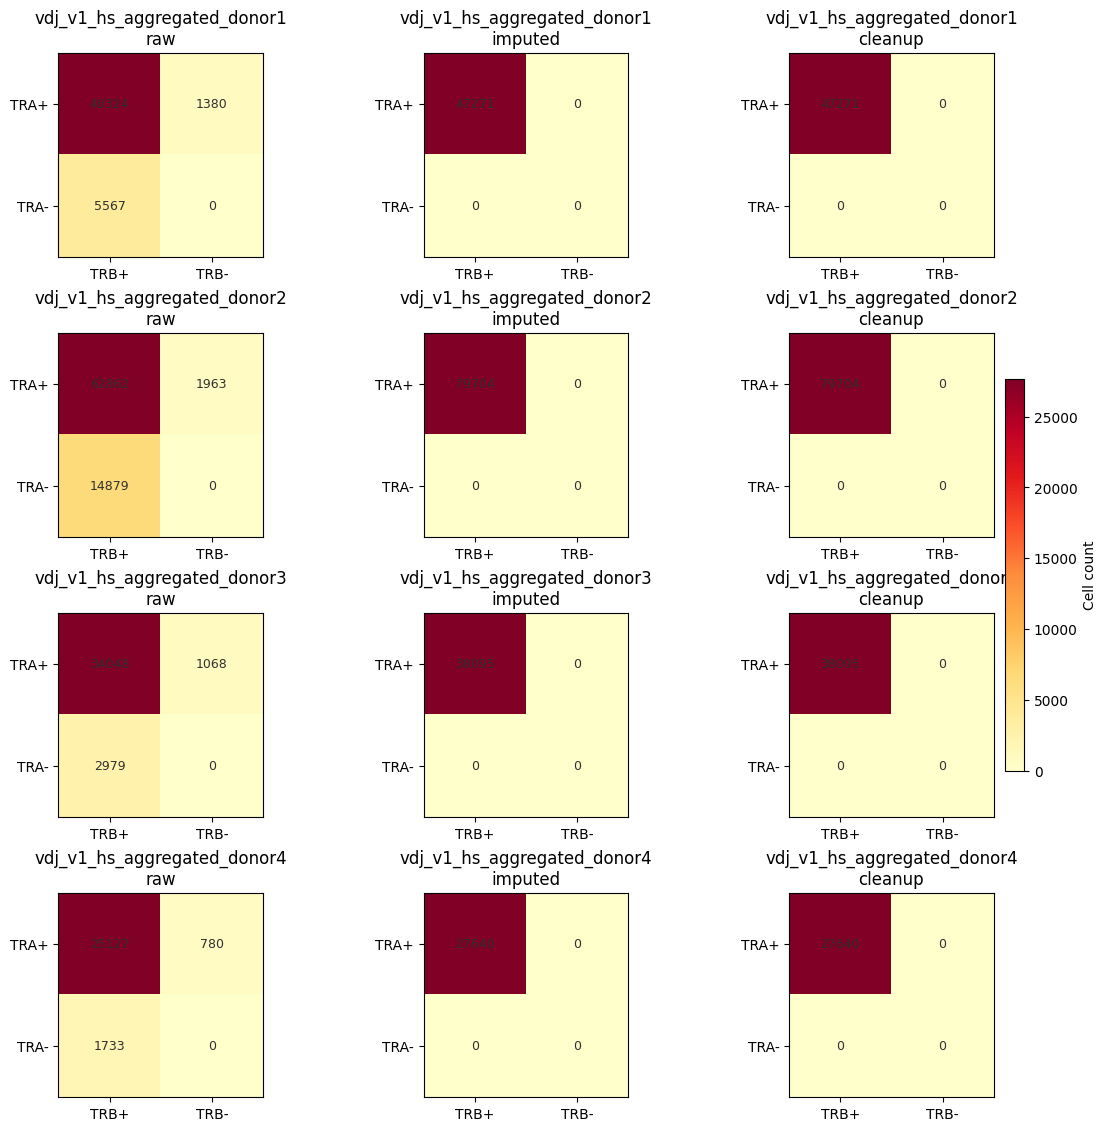
Build Raw, Imputed, and Cleanup Graphs#
Compute stage summaries, impute/cleanup runtimes, and TRA/TRB stage heatmaps for each sample.
[4]:
# Build per-sample stage outputs, timing metrics, and TRA/TRB stage heatmaps.
CHAIN_COLORS = {
    "TRA": "#1f77b4",
    "TRB": "#ff7f0e",
    "TRG": "#2ca02c",
    "TRD": "#d62728",
    "IGH": "#9467bd",
    "IGK": "#8c564b",
    "IGL": "#e377c2",
}

TRA_LEVELS = ["TRA+", "TRA-"]
TRB_LEVELS = ["TRB+", "TRB-"]
STAGE_ORDER = ["raw", "imputed", "cleanup"]


def tra_trb_counts(sample):
    m = sample.chain_multiplicity.filter(pl.col("locus_pair") == "TRA_TRB")
    if m.height == 0:
        return pl.DataFrame({"tra": [], "trb": [], "cell_count": []})
    return (
        m.with_columns(
            pl.when(pl.col("n_chain1") > 0).then(pl.lit("TRA+")).otherwise(pl.lit("TRA-")).alias("tra"),
            pl.when(pl.col("m_chain2") > 0).then(pl.lit("TRB+")).otherwise(pl.lit("TRB-")).alias("trb"),
        )
        .group_by(["tra", "trb"])
        .agg(pl.sum("cell_count").alias("cell_count"))
    )


def build_heatmap_matrix(counts_df):
    lookup = {(r["tra"], r["trb"]): int(r["cell_count"]) for r in counts_df.iter_rows(named=True)}
    return [[lookup.get((tra, trb), 0) for trb in TRB_LEVELS] for tra in TRA_LEVELS]


stage_results = {}
summary_rows = []
heatmap_rows = []

for sample_id, cp, ap in pairs[:4]:
    raw = run_step(
        f"raw_parse_{sample_id}",
        load_10x_vdj_v1_cell_clonotypes,
        cp,
        ap,
        sample_id=sample_id,
    )

    t_impute_start = time.perf_counter()
    imputed = impute_missing_chains(raw, seed=SEED, reuse_slave_per_master=True)
    t_impute = time.perf_counter() - t_impute_start

    t_cleanup_start = time.perf_counter()
    cleaned = cleanup_cell_clonotypes(
        imputed,
        enforce_consistent_slave_per_master=True,
        consistency_only_on_synthetic_slave=True,
        max_slave_edges_per_master=10,
    )
    t_cleanup = time.perf_counter() - t_cleanup_start

    raw_sample = build_tenx_sample_from_cell_clonotypes(raw, sample_id=sample_id)
    imp_sample = build_tenx_sample_from_cell_clonotypes(imputed, sample_id=sample_id)
    cln_sample = build_tenx_sample_from_cell_clonotypes(cleaned, sample_id=sample_id)

    raw_graph = build_pairing_graph(raw_sample)
    imp_graph = build_pairing_graph(imp_sample)
    cln_graph = build_pairing_graph(cln_sample)

    stage_results[sample_id] = {
        "raw": raw_graph,
        "imputed": imp_graph,
        "cleanup": cln_graph,
    }

    for stage, table, sample in [
        ("raw", raw, raw_sample),
        ("imputed", imputed, imp_sample),
        ("cleanup", cleaned, cln_sample),
    ]:
        graph = stage_results[sample_id][stage]
        summary_rows.append(
            {
                "sample_id": sample_id,
                "stage": stage,
                "cell_rows": table.height,
                "nodes": graph.nodes.height,
                "edges": graph.edges.height,
                "impute_seconds": t_impute if stage == "imputed" else None,
                "cleanup_seconds": t_cleanup if stage == "cleanup" else None,
            }
        )

        counts_df = tra_trb_counts(sample)
        for row in counts_df.iter_rows(named=True):
            heatmap_rows.append(
                {
                    "sample_id": sample_id,
                    "stage": stage,
                    "tra": row["tra"],
                    "trb": row["trb"],
                    "cell_count": int(row["cell_count"]),
                }
            )

summary_df = pl.DataFrame(summary_rows).sort(["sample_id", "stage"])
heatmap_df = pl.DataFrame(heatmap_rows).sort(["sample_id", "stage", "tra", "trb"])

print("Stage summary:")
display(summary_df)

# Render TRA/TRB heatmaps across samples and stages.
samples = sorted(heatmap_df["sample_id"].unique().to_list())
fig, axes = plt.subplots(len(samples), len(STAGE_ORDER), figsize=(12, 2.8 * len(samples)), constrained_layout=True)
if len(samples) == 1:
    axes = [axes]

for i, sample_id in enumerate(samples):
    for j, stage in enumerate(STAGE_ORDER):
        ax = axes[i][j]
        stage_counts = heatmap_df.filter((pl.col("sample_id") == sample_id) & (pl.col("stage") == stage))
        matrix = build_heatmap_matrix(stage_counts)
        im = ax.imshow(matrix, cmap="YlOrRd")
        ax.set_xticks(range(len(TRB_LEVELS)), TRB_LEVELS)
        ax.set_yticks(range(len(TRA_LEVELS)), TRA_LEVELS)
        ax.set_title(f"{sample_id}\n{stage}")
        for r_idx in range(len(TRA_LEVELS)):
            for c_idx in range(len(TRB_LEVELS)):
                ax.text(c_idx, r_idx, str(matrix[r_idx][c_idx]), ha="center", va="center", color="#2f2f2f", fontsize=9)

cbar = fig.colorbar(im, ax=axes, fraction=0.018, pad=0.01)
cbar.set_label("Cell count")
plt.show()
raw_parse_vdj_v1_hs_aggregated_donor1: 0.50s
raw_parse_vdj_v1_hs_aggregated_donor2: 1.22s
raw_parse_vdj_v1_hs_aggregated_donor3: 0.60s
raw_parse_vdj_v1_hs_aggregated_donor4: 0.60s
Stage summary:
shape: (12, 7)
| sample_id | stage | cell_rows | nodes | edges | impute_seconds | cleanup_seconds |
|---|---|---|---|---|---|---|
| str | str | i64 | i64 | i64 | f64 | f64 |
| "vdj_v1_hs_aggregated_donor1" | "cleanup" | 100250 | 64088 | 33787 | null | 0.614461 |
| "vdj_v1_hs_aggregated_donor1" | "imputed" | 102610 | 66280 | 36773 | 21.085819 | null |
| "vdj_v1_hs_aggregated_donor1" | "raw" | 95663 | 56312 | 31458 | null | null |
| "vdj_v1_hs_aggregated_donor2" | "cleanup" | 163532 | 44380 | 23774 | null | 1.18233 |
| "vdj_v1_hs_aggregated_donor2" | "imputed" | 168351 | 47658 | 28100 | 29.78329 | null |
| … | … | … | … | … | … | … |
| "vdj_v1_hs_aggregated_donor3" | "imputed" | 81080 | 40583 | 23223 | 14.371611 | null |
| "vdj_v1_hs_aggregated_donor3" | "raw" | 77033 | 35411 | 20259 | null | null |
| "vdj_v1_hs_aggregated_donor4" | "cleanup" | 57493 | 34749 | 18505 | null | 0.467091 |
| "vdj_v1_hs_aggregated_donor4" | "imputed" | 58859 | 36015 | 20319 | 15.912793 | null |
| "vdj_v1_hs_aggregated_donor4" | "raw" | 56346 | 31967 | 18075 | null | null |
[5]:
# Plot graph panels for each sample and stage with igraph (bounded size for speed and readability).
def _igraph_from_pairing_graph(pairing_graph, *, max_edges=1500):
edges_df = pairing_graph.edges.sort("cell_count", descending=True).head(max_edges)
edge_rows = edges_df.to_dicts()
edge_nodes = set()
for row in edge_rows:
edge_nodes.add(row["source"])
edge_nodes.add(row["target"])
nodes_df = pairing_graph.nodes.filter(pl.col("node_id").is_in(list(edge_nodes)))
node_rows = nodes_df.to_dicts()
name_to_idx = {row["node_id"]: idx for idx, row in enumerate(node_rows)}
edges = [(name_to_idx[row["source"]], name_to_idx[row["target"]]) for row in edge_rows]
weights = [max(1, int(row["cell_count"])) for row in edge_rows]
g = ig.Graph(n=len(node_rows), edges=edges, directed=False)
g.vs["name"] = [row["node_id"] for row in node_rows]
g.vs["locus"] = [row["locus"] for row in node_rows]
g.vs["color"] = [CHAIN_COLORS.get(row["locus"], "#7f7f7f") for row in node_rows]
g.es["weight"] = weights
return g
def _plot_igraph(ax, g, title):
if g.vcount() == 0:
ax.set_title(f"{title} (empty)")
ax.axis("off")
return
layout = g.layout_fruchterman_reingold(weights=g.es["weight"], niter=1200)
xs = [p[0] for p in layout]
ys = [p[1] for p in layout]
max_w = max(g.es["weight"]) if g.ecount() > 0 else 1
for e in g.es:
s, t = e.tuple
# Log-scaled widths keep heavy edges visible without saturating the plot.
width = 0.2 + 1.4 * (float(e["weight"]) / float(max_w)) ** 0.5
ax.plot(
[xs[s], xs[t]],
[ys[s], ys[t]],
color="#9a9a9a",
alpha=0.18,
linewidth=width,
)
ax.scatter(xs, ys, c=g.vs["color"], s=12, alpha=0.9)
ax.set_title(title)
ax.axis("off")
for sample_id in sorted(stage_results):
fig, axes = plt.subplots(1, 3, figsize=(16, 5), constrained_layout=True)
for ax, stage in zip(axes, ["raw", "imputed", "cleanup"]):
ig_graph = _igraph_from_pairing_graph(stage_results[sample_id][stage])
_plot_igraph(ax, ig_graph, f"{sample_id}\n{stage}")
fig.suptitle(f"Pairing graphs for {sample_id}")
plt.show()
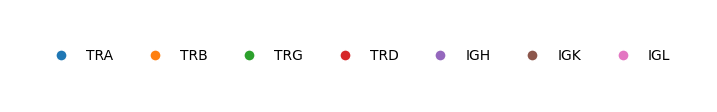
legend_handles = [
plt.Line2D([0], [0], marker="o", color="w", label=locus, markerfacecolor=color, markersize=8)
for locus, color in CHAIN_COLORS.items()
]
fig, ax = plt.subplots(figsize=(9, 1.2))
ax.legend(handles=legend_handles, ncol=7, loc="center", frameon=False)
ax.axis("off")
plt.show()