T-cell repertoire annotation and motif discovery (TCRNET-style)#
This notebook demonstrates a highly customized MIR implementation of TCRNET-style analysis for antigen-associated TCR motif discovery. The workflow is inspired by ideas described in the TCRNET framework paper and is not a literal line-by-line reimplementation of the original software.
Samples:
(B35+)       HIP02877  A*26 A*33 B*14 B*35  CMV-
(CMV+)       HIP13994  A*02 A*02 B*07 B*44  CMV+
Control repertoire:
control.txt.gz
Inputs:
airr_benchmark/tcrnet/CMV+.txt.gzairr_benchmark/tcrnet/B35+.txt.gzairr_benchmark/tcrnet/control.txt.gzlatest
airr_benchmark/vdjdb/**/vdjdb.slim.txt.gz
Reference: Pogorelyy MV, Shugay M. A Framework for Annotation of Antigen Specificities in High-Throughput T-Cell Repertoire Sequencing Studies. Front Immunol. 2019;10:2159. doi:10.3389/fimmu.2019.02159. PMID:31616409. PubMed: https://pubmed.ncbi.nlm.nih.gov/31616409/
[ ]:
import importlib.metadata as _meta
import sys as _sys
import warnings

warnings.filterwarnings('ignore', message='IProgress not found.*')

print(f"Python {_sys.version.split()[0]}")
for _pkg in ["mirpy-lib", "numpy", "pandas", "matplotlib", "scipy", "polars"]:
    try:
        print(f"  {_pkg}: {_meta.version(_pkg)}")
    except _meta.PackageNotFoundError:
        pass

import sys
from pathlib import Path

import igraph as ig
import matplotlib.pyplot as plt
import numpy as np
import pandas as pd
from matplotlib.colors import LogNorm, to_rgba
from scipy.stats import binomtest, mannwhitneyu, spearmanr

repo_root = Path.cwd().resolve().parent if Path.cwd().name == "notebooks" else Path.cwd().resolve()
if str(repo_root) not in sys.path:
    sys.path.insert(0, str(repo_root))

from mir.biomarkers.tcrnet import compute_tcrnet
from mir.common.clonotype import Clonotype
from mir.common.filter import filter_functional
from mir.common.parser import ClonotypeTableParser
from mir.common.repertoire import LocusRepertoire
from mir.graph.edit_distance_graph import build_edit_distance_graph
from mir.utils.notebook_assets import ensure_airr_benchmark, find_airr_benchmark_vdjdb_slim

CORES = 4
BENCHMARK_ROOT = ensure_airr_benchmark(repo_root, allow_patterns=["tcrnet/**", "vdjdb/**"])
TCRNET_DIR = BENCHMARK_ROOT / "tcrnet"
VDJDB_PATH = find_airr_benchmark_vdjdb_slim(BENCHMARK_ROOT)

SAMPLE_HLAS = {
    'B35+': ['HLA-A*26', 'HLA-A*33', 'HLA-B*14', 'HLA-B*35'],
    'CMV+': ['HLA-A*02', 'HLA-B*07', 'HLA-B*44'],
}

parser = ClonotypeTableParser()


def bh_adjust(p_values: pd.Series) -> pd.Series:
    values = pd.Series(p_values, dtype=float)
    if values.empty:
        return values
    order = np.argsort(values.to_numpy())
    ranked = values.to_numpy()[order]
    n = len(ranked)
    adjusted = np.empty(n, dtype=float)
    running = 1.0
    for i in range(n - 1, -1, -1):
        rank = i + 1
        running = min(running, ranked[i] * n / rank)
        adjusted[i] = running
    out = np.empty(n, dtype=float)
    out[order] = np.clip(adjusted, 0.0, 1.0)
    return pd.Series(out, index=values.index)


def load_trb(path: str | Path, sample_id: str) -> LocusRepertoire:
    clones = filter_functional(LocusRepertoire(parser.parse(str(path)), locus='TRB', repertoire_id=sample_id)).clonotypes
    rep = LocusRepertoire(clonotypes=clones, locus='TRB', repertoire_id=sample_id)
    return rep


def repertoire_to_sequence_table(rep: LocusRepertoire, sample_id: str) -> pd.DataFrame:
    rows = []
    total = max(1, rep.duplicate_count)
    for clonotype in rep.clonotypes:
        rows.append(
            {
                'cdr3aa': clonotype.junction_aa,
                'count': clonotype.duplicate_count,
                'v_gene': clonotype.v_gene,
                'j_gene': clonotype.j_gene,
                'sample_id': sample_id,
            }
        )
    df = pd.DataFrame(rows)
    grouped = (
        df.groupby(['cdr3aa', 'sample_id'], as_index=False)
        .agg(count=('count', 'sum'), v_gene=('v_gene', 'first'), j_gene=('j_gene', 'first'))
    )
    grouped['freq'] = grouped['count'] / total
    return grouped


def mhc_a_base(series: pd.Series) -> pd.Series:
    return series.fillna('').astype(str).str.split(':').str[0].str.split(',').str[0]


def load_vdjdb_reference(path: Path) -> tuple[pd.DataFrame, LocusRepertoire]:
    raw = pd.read_csv(path, sep='\t', compression='gzip')
    raw = raw[raw['gene'].eq('TRB')].copy()
    epi_sizes = raw.groupby('antigen.epitope')['cdr3'].nunique()
    raw = raw[raw['antigen.epitope'].map(epi_sizes).ge(30)].reset_index(drop=True)
    raw['mhc.a.base'] = mhc_a_base(raw['mhc.a'])
    raw['epi.name'] = raw['mhc.a.base'].str.replace('HLA-', '', regex=False).str[:6].str.strip() + ' ' + raw['antigen.epitope'].astype(str).str[:3]
    raw['antigen.species'] = raw['antigen.species'].replace({'DENV': 'DengueVirus'})

    clonotypes = []
    for idx, row in raw.iterrows():
        clonotypes.append(
            Clonotype(
                sequence_id=str(idx),
                locus='TRB',
                junction_aa=str(row['cdr3']),
                v_gene=str(row.get('v.segm', '') or ''),
                j_gene=str(row.get('j.segm', '') or ''),
                duplicate_count=1,
                _validate=False,
            )
        )
    return raw, LocusRepertoire(clonotypes=clonotypes, locus='TRB')


def annotate_repertoire_with_vdjdb(rep: LocusRepertoire, sample_id: str, vdjdb_df: pd.DataFrame, vdjdb_rep: LocusRepertoire) -> pd.DataFrame:
    seq_df = repertoire_to_sequence_table(rep, sample_id)
    rows = []
    for rec in seq_df.itertuples(index=False):
        hits = vdjdb_rep.trie.SearchIndices(
            query=rec.cdr3aa,
            maxSubstitution=1,
            maxInsertion=0,
            maxDeletion=0,
            maxEdits=1,
        )
        for idx, distance in hits:
            hit = vdjdb_df.iloc[int(idx)]
            rows.append(
                {
                    'cdr3aa': rec.cdr3aa,
                    'sample_id': sample_id,
                    'count': rec.count,
                    'freq': rec.freq,
                    'distance': int(distance),
                    'antigen.epitope': hit['antigen.epitope'],
                    'antigen.species': hit['antigen.species'],
                    'mhc.a': hit['mhc.a'],
                    'mhc.a.base': hit['mhc.a.base'],
                    'mhc.b': hit['mhc.b'],
                    'mhc.class': hit['mhc.class'],
                    'reference.id': hit['reference.id'],
                    'vdjdb.score': hit['vdjdb.score'],
                    'epi.name': hit['epi.name'],
                }
            )
    if not rows:
        return pd.DataFrame(columns=['cdr3aa', 'sample_id', 'count', 'freq', 'distance', 'antigen.epitope', 'antigen.species', 'mhc.a', 'mhc.a.base', 'mhc.b', 'mhc.class', 'reference.id', 'vdjdb.score', 'epi.name'])
    return pd.DataFrame(rows)


def quality_filter_annotations(df: pd.DataFrame) -> pd.DataFrame:
    if df.empty:
        return df.copy()
    df = (
        df.groupby(['cdr3aa', 'antigen.epitope', 'antigen.species', 'mhc.a', 'sample_id', 'vdjdb.score', 'reference.id'], as_index=False)
        .agg(count=('count', 'sum'), freq=('freq', 'sum'), mhc_b=('mhc.b', 'first'), mhc_class=('mhc.class', 'first'), mhc_a_base=('mhc.a.base', 'first'), epi_name=('epi.name', 'first'))
        .rename(columns={'mhc_b': 'mhc.b', 'mhc_class': 'mhc.class', 'mhc_a_base': 'mhc.a.base', 'epi_name': 'epi.name'})
    )
    good = df[['cdr3aa', 'antigen.epitope', 'mhc.a', 'vdjdb.score', 'reference.id']].drop_duplicates().copy()
    good['vdjdb.score.max'] = good.groupby('cdr3aa')['vdjdb.score'].transform('max')
    good = good[good['vdjdb.score'].eq(good['vdjdb.score.max'])].copy()
    good['num.pub'] = good['reference.id'].fillna('').str.count('PMID')
    good['num.pub.max'] = good.groupby('cdr3aa')['num.pub'].transform('max')
    good = good[good['num.pub'].eq(good['num.pub.max'])].copy()
    good['num.spec'] = good.groupby('cdr3aa')['antigen.epitope'].transform('nunique')
    good = good[good['num.spec'].eq(1)][['cdr3aa', 'antigen.epitope', 'mhc.a', 'vdjdb.score', 'reference.id']].drop_duplicates()
    return df.merge(good, on=['cdr3aa', 'antigen.epitope', 'mhc.a', 'vdjdb.score', 'reference.id'])


def wilcox_by_epitope(sample_df: pd.DataFrame, control_df: pd.DataFrame) -> pd.DataFrame:
    rows = []
    for (sample_id, epi_name), group in sample_df.groupby(['sample_id', 'epi.name']):
        ctrl = control_df[control_df['sample_id'].eq(sample_id) & control_df['epi.name'].eq(epi_name)]['count']
        if ctrl.empty:
            ctrl = control_df[control_df['epi.name'].eq(epi_name)]['count']
        if group['count'].empty or ctrl.empty:
            continue
        stat = mannwhitneyu(group['count'], ctrl, alternative='two-sided')
        rows.append({'sample_id': sample_id, 'epi.name': epi_name, 'p.value': stat.pvalue})
    out = pd.DataFrame(rows)
    if not out.empty:
        out['p.value.adj'] = bh_adjust(out['p.value'])
    return out.sort_values('p.value') if not out.empty else out


def donor_filter(df: pd.DataFrame) -> pd.DataFrame:
    parts = []
    for sample_id, hlas in SAMPLE_HLAS.items():
        subset = df[df['sample_id'].eq(sample_id)].copy()
        subset = subset[subset['mhc.a.base'].isin(hlas)]
        if sample_id == 'CMV+':
            subset = subset[subset['antigen.species'].eq('CMV')]
        else:
            subset = subset[subset['antigen.species'].ne('CMV')]
        parts.append(subset)
    return pd.concat(parts, ignore_index=True) if parts else pd.DataFrame(columns=df.columns)


def donor_control_filter(df_control: pd.DataFrame) -> pd.DataFrame:
    parts = []
    for sample_id, hlas in SAMPLE_HLAS.items():
        subset = df_control.copy()
        subset = subset[subset['mhc.a.base'].isin(hlas)].copy()
        if sample_id == 'CMV+':
            subset = subset[subset['antigen.species'].eq('CMV')]
        else:
            subset = subset[subset['antigen.species'].ne('CMV')]
        subset['sample_id'] = sample_id
        parts.append(subset)
    return pd.concat(parts, ignore_index=True) if parts else pd.DataFrame(columns=df_control.columns)


def plot_boxpanels(sample_df: pd.DataFrame, control_df: pd.DataFrame, title: str) -> None:
    sample_ids = list(sample_df['sample_id'].drop_duplicates())
    species = sorted(sample_df['antigen.species'].dropna().unique())
    cmap = plt.get_cmap('Paired', max(1, len(species)))
    species_colors = {sp: cmap(i) for i, sp in enumerate(species)}
    fig, axes = plt.subplots(1, len(sample_ids), figsize=(7 * len(sample_ids), 6), squeeze=False)
    for ax, sample_id in zip(axes[0], sample_ids):
        sample_sub = sample_df[sample_df['sample_id'].eq(sample_id)].copy()
        control_sub = control_df[control_df['sample_id'].eq(sample_id)].copy()
        if control_sub.empty:
            control_sub = control_df.copy()
        order = (
            sample_sub.groupby('epi.name', as_index=False)
            .agg(freq=('freq', 'max'), antigen_species=('antigen.species', 'first'))
            .sort_values(['freq', 'antigen_species'])['epi.name']
            .tolist()
        )
        positions = np.arange(len(order), dtype=float)
        control_values = [control_sub[control_sub['epi.name'].eq(epi)]['count'].to_numpy() for epi in order]
        sample_values = [sample_sub[sample_sub['epi.name'].eq(epi)]['count'].to_numpy() for epi in order]
        bp_control = ax.boxplot(control_values, positions=positions - 0.18, widths=0.32, patch_artist=True, showfliers=False)
        for patch in bp_control['boxes']:
            patch.set(facecolor='lightgrey', edgecolor='grey')
        bp_sample = ax.boxplot(sample_values, positions=positions + 0.18, widths=0.32, patch_artist=True, showfliers=False)
        for patch, epi in zip(bp_sample['boxes'], order):
            species_name = sample_sub[sample_sub['epi.name'].eq(epi)]['antigen.species'].iloc[0]
            patch.set(facecolor=(1, 1, 1, 0), edgecolor=species_colors.get(species_name, 'black'), linewidth=1.5)
        ax.set_xticks(positions)
        ax.set_xticklabels(order, rotation=90)
        ax.set_yscale('log')
        ax.set_ylabel('# reads')
        ax.set_title(sample_id)
        ax.grid(False)
    fig.suptitle(title)
    plt.tight_layout()
    plt.show()


def tcrnet_table_with_counts(rep: LocusRepertoire, sample_id: str, result_table: pd.DataFrame) -> pd.DataFrame:
    counts = repertoire_to_sequence_table(rep, sample_id)[['cdr3aa', 'count', 'freq']].rename(columns={'cdr3aa': 'junction_aa'})
    # result_table is a Polars DataFrame from compute_tcrnet — convert to pandas
    tbl_pd = result_table.to_pandas() if hasattr(result_table, "to_pandas") else result_table
    table = tbl_pd.merge(counts, on='junction_aa', how='left')
    table['sample_id'] = sample_id
    table = table.rename(columns={'junction_aa': 'cdr3aa', 'fold_enrichment': 'fold'})
    table = table[table['count'].fillna(0).gt(1)].copy()
    table['p.adj'] = bh_adjust(table['p_value'])
    return table.sort_values(['p.adj', 'fold'], ascending=[True, False]).reset_index(drop=True)


def sequences_to_clonotypes(df: pd.DataFrame) -> list[Clonotype]:
    clonotypes = []
    for idx, row in enumerate(df.drop_duplicates('cdr3aa').itertuples(index=False)):
        clonotypes.append(
            Clonotype(
                sequence_id=str(idx),
                locus='TRB',
                junction_aa=row.cdr3aa,
                duplicate_count=int(row.count),
                v_gene=str(getattr(row, 'v_gene', '') or ''),
                j_gene=str(getattr(row, 'j_gene', '') or ''),
                _validate=False,
            )
        )
    return clonotypes


def collect_neighbor_sequences(rep: LocusRepertoire, query_sequences: list[str]) -> set[str]:
    found = set()
    for seq in query_sequences:
        hits = rep.trie.SearchIndices(seq, maxSubstitution=1, maxInsertion=0, maxDeletion=0, maxEdits=1)
        for idx, _ in hits:
            found.add(rep.clonotypes[int(idx)].junction_aa)
    return found


def layout_graph_df(node_df: pd.DataFrame, sample_id: str) -> pd.DataFrame:
    if node_df.empty:
        return pd.DataFrame(columns=['cdr3aa', 'x', 'y', 'cid', 'cid2', 'sample_id', 'freq', 'count'])
    graph = build_edit_distance_graph(sequences_to_clonotypes(node_df), metric='hamming', threshold=1, nproc=CORES)
    coords = np.asarray(graph.layout_graphopt(niter=3000, node_charge=0.005)) if graph.vcount() else np.empty((0, 2))
    membership = graph.components().membership if graph.vcount() else []
    layout = pd.DataFrame(
        {
            'cdr3aa': graph.vs['name'],
            'x': coords[:, 0] if len(coords) else [],
            'y': coords[:, 1] if len(coords) else [],
            'cid': membership,
            'sample_id': sample_id,
        }
    )
    layout['cid2'] = layout['sample_id'] + '_C' + layout['cid'].astype(str)
    return layout.merge(node_df[['cdr3aa', 'freq', 'count']].drop_duplicates(), on='cdr3aa', how='left')


def plot_graph_panels(df_layout: pd.DataFrame, color_by: str | None, title: str, annotate_only: bool = False) -> None:
    sample_ids = list(df_layout['sample_id'].drop_duplicates())
    fig, axes = plt.subplots(1, len(sample_ids), figsize=(7 * len(sample_ids), 6), squeeze=False)
    for ax, sample_id in zip(axes[0], sample_ids):
        sub = df_layout[df_layout['sample_id'].eq(sample_id)].copy()
        if sub.empty:
            continue
        sizes = np.sqrt(sub['freq'].fillna(0).to_numpy() + 1e-12) * 200
        if annotate_only:
            ax.scatter(sub['x'], sub['y'], s=np.maximum(sizes, 10), color='grey', alpha=0.35)
            colored = sub[sub[color_by].notna()].copy()
            if not colored.empty:
                for label, grp in colored.groupby(color_by):
                    ax.scatter(grp['x'], grp['y'], s=np.maximum(np.sqrt(grp['freq'].to_numpy() + 1e-12) * 220, 14), label=label, alpha=0.9)
                ax.legend(loc='lower center', bbox_to_anchor=(0.5, -0.22), ncol=2, fontsize=8)
        elif color_by is None:
            ax.scatter(sub['x'], sub['y'], s=np.maximum(sizes, 10), color='grey40', alpha=0.9)
        else:
            ax.scatter(sub['x'], sub['y'], s=np.maximum(sizes, 10), c=sub[color_by], cmap='Set1', alpha=0.9)
        ax.set_title(sample_id)
        ax.set_xlabel('MDS1')
        ax.set_ylabel('MDS2')
        ax.set_aspect('equal', adjustable='datalim')
        ax.grid(False)
    fig.suptitle(title)
    plt.tight_layout()
    plt.show()


def cluster_annotation_stats(df_layout_annot: pd.DataFrame) -> pd.DataFrame:
    rows = []
    for sample_id, sample_df in df_layout_annot.groupby('sample_id'):
        total_sample = len(sample_df)
        epi_totals = sample_df.dropna(subset=['epi.name']).groupby('epi.name').size().to_dict()
        for (cid2, epi_name), group in sample_df.dropna(subset=['epi.name']).groupby(['cid2', 'epi.name']):
            total_cluster = int(sample_df[sample_df['cid2'].eq(cid2)].shape[0])
            total_epi = int(epi_totals[epi_name])
            count_matched = int(group.shape[0])
            expected_fraction = total_epi / total_sample if total_sample else 0.0
            test = binomtest(count_matched, total_cluster, expected_fraction)
            rows.append(
                {
                    'sample_id': sample_id,
                    'cid2': cid2,
                    'epi.name': epi_name,
                    'total.sample': total_sample,
                    'total.epi': total_epi,
                    'total.cluster': total_cluster,
                    'count.matched': count_matched,
                    'fraction.matched': count_matched / total_cluster if total_cluster else 0.0,
                    'fraction.matched.e': expected_fraction,
                    'p.value': test.pvalue,
                }
            )
    out = pd.DataFrame(rows)
    if not out.empty:
        out['p.value.adj'] = bh_adjust(out['p.value'])
    return out.sort_values('p.value') if not out.empty else out

# Publication-quality matplotlib style (Nature/Science aesthetics)
plt.rcParams.update({
    "font.family": "sans-serif",
    "font.sans-serif": ["Arial", "Helvetica", "DejaVu Sans"],
    "font.size": 10,
    "axes.titlesize": 11,
    "axes.labelsize": 10,
    "xtick.labelsize": 9,
    "ytick.labelsize": 9,
    "legend.fontsize": 9,
    "figure.dpi": 150,
    "savefig.dpi": 300,
    "axes.linewidth": 0.8,
    "axes.spines.top": False,
    "axes.spines.right": False,
    "xtick.major.size": 3.5,
    "ytick.major.size": 3.5,
    "xtick.direction": "out",
    "ytick.direction": "out",
    "axes.grid": False,
})
Python 3.12.12
  mirpy-lib: 1.1.0
  numpy: 1.26.4
  pandas: 3.0.3
  matplotlib: 3.10.9
  scipy: 1.17.1
  polars: 1.40.1
/Users/mikesh/vcs/mirpy/.venv/lib/python3.12/site-packages/tqdm/auto.py:21: TqdmWarning: IProgress not found. Please update jupyter and ipywidgets. See https://ipywidgets.readthedocs.io/en/stable/user_install.html
  from .autonotebook import tqdm as notebook_tqdm
[2]:
def plot_boxpanels(sample_df: pd.DataFrame, control_df: pd.DataFrame, title: str) -> None:
    sample_ids = list(sample_df['sample_id'].drop_duplicates())
    species = sorted(sample_df['antigen.species'].dropna().unique())
    cmap = plt.get_cmap('Paired', max(1, len(species)))
    species_colors = {sp: cmap(i) for i, sp in enumerate(species)}
    fig, axes = plt.subplots(1, len(sample_ids), figsize=(8 * len(sample_ids), 10), squeeze=False)
    for ax, sample_id in zip(axes[0], sample_ids):
        sample_sub = sample_df[sample_df['sample_id'].eq(sample_id)].copy()
        control_sub = control_df[control_df['sample_id'].eq(sample_id)].copy()
        if control_sub.empty:
            control_sub = control_df.copy()
        order = (
            sample_sub.groupby('epi.name', as_index=False)
            .agg(freq=('freq', 'max'), antigen_species=('antigen.species', 'first'))
            .sort_values(['freq', 'antigen_species'], ascending=[True, True])['epi.name']
            .tolist()
        )
        positions = np.arange(len(order), dtype=float)
        control_values = [control_sub[control_sub['epi.name'].eq(epi)]['count'].to_numpy() for epi in order]
        sample_values = [sample_sub[sample_sub['epi.name'].eq(epi)]['count'].to_numpy() for epi in order]
        bp_control = ax.boxplot(control_values, positions=positions - 0.18, widths=0.32, patch_artist=True, showfliers=False, vert=False)
        for patch in bp_control['boxes']:
            patch.set(facecolor='lightgrey', edgecolor='grey')
        bp_sample = ax.boxplot(sample_values, positions=positions + 0.18, widths=0.32, patch_artist=True, showfliers=False, vert=False)
        for patch, epi in zip(bp_sample['boxes'], order):
            species_name = sample_sub[sample_sub['epi.name'].eq(epi)]['antigen.species'].iloc[0]
            patch.set(facecolor=(1, 1, 1, 0), edgecolor=species_colors.get(species_name, 'black'), linewidth=1.5)
        ax.set_yticks(positions)
        ax.set_yticklabels(order)
        ax.set_xscale('log')
        ax.set_xlabel('# reads')
        ax.set_title(sample_id)
        ax.grid(False)
    fig.suptitle(title)
    plt.tight_layout()
    plt.show()
[3]:
cmv_rep_full = load_trb(TCRNET_DIR / 'CMV+.txt.gz', 'CMV+')
b35_rep_full = load_trb(TCRNET_DIR / 'B35+.txt.gz', 'B35+')
control_rep_full = load_trb(TCRNET_DIR / 'control.txt.gz', 'control')

basic_stats = pd.DataFrame(
    [
        {'sample_id': 'control', 'n_clonotypes': len(control_rep_full.clonotypes), 'n_reads': control_rep_full.duplicate_count},
        {'sample_id': 'CMV+', 'n_clonotypes': len(cmv_rep_full.clonotypes), 'n_reads': cmv_rep_full.duplicate_count},
        {'sample_id': 'B35+', 'n_clonotypes': len(b35_rep_full.clonotypes), 'n_reads': b35_rep_full.duplicate_count},
    ]
)
basic_stats
[3]:
| sample_id | n_clonotypes | n_reads | |
|---|---|---|---|
| 0 | control | 873611 | 10376685 |
| 1 | CMV+ | 147536 | 3094067 |
| 2 | B35+ | 61368 | 865505 |
Explore VDJdb annotation results#
Load local VDJdb annotations, match repertoires with one substitution allowed, and apply the same ambiguity filtering logic as in the reference workflow.
[4]:
vdjdb_raw, vdjdb_rep = load_vdjdb_reference(VDJDB_PATH)

df_vdjdb = pd.concat(
    [
        annotate_repertoire_with_vdjdb(control_rep_full, 'control', vdjdb_raw, vdjdb_rep),
        annotate_repertoire_with_vdjdb(cmv_rep_full, 'CMV+', vdjdb_raw, vdjdb_rep),
        annotate_repertoire_with_vdjdb(b35_rep_full, 'B35+', vdjdb_raw, vdjdb_rep),
    ],
    ignore_index=True,
)

df_vdjdb = quality_filter_annotations(df_vdjdb)
df_vdjdb_control = df_vdjdb[df_vdjdb['sample_id'].eq('control')].copy()
df_vdjdb = df_vdjdb[df_vdjdb['sample_id'].ne('control')].copy()

df_vdjdb.head()
Skipping too long sequence CASSYSTVLHGCLLSAQKDHTGAGVSQSPSNKVTEKGKDVELRCDPISGHTALYWYRQRLGQGLEFLIYFQGNSAPDKSGLPSDRFSAERTGESVSTLTIQRTQQEDSAVYLCAAPSQGESDEQFF: length = 126
[4]:
| cdr3aa | antigen.epitope | antigen.species | mhc.a | sample_id | vdjdb.score | reference.id | count | freq | mhc.b | mhc.class | mhc.a.base | epi.name | |
|---|---|---|---|---|---|---|---|---|---|---|---|---|---|
| 0 | CAAADANTGELFF | YLQPRTFLL | SARS-CoV-2 | HLA-A*02:01 | CMV+ | 0 | PMID:33664060 | 3 | 9.695976e-07 | B2M | MHCI | HLA-A*02 | A*02 YLQ |
| 9 | CAAGGNQPQHF | NLVPMVATV | CMV | HLA-A*02:01 | CMV+ | 0 | PMID:39746936 | 34 | 1.098877e-05 | B2M | MHCI | HLA-A*02 | A*02 NLV |
| 11 | CAAGGSNQPQHF | FLYNLLTRV | HomoSapiens | HLA-A*02:01 | B35+ | 0 | PMID:25837513 | 20 | 2.310790e-05 | B2M | MHCI | HLA-A*02 | A*02 FLY |
| 19 | CAAGSSGANVLTF | GILGFVFTL | InfluenzaA | HLA-A*02 | CMV+ | 0 | PMID:28423320 | 13 | 4.201590e-06 | B2M | MHCI | HLA-A*02 | A*02 GIL |
| 21 | CAAGTGDSNQPQHF | EPLPQGQLTAY | EBV | HLA-B*35:01,HLA-B*35:42:01 | B35+ | 3 | PMID:16148129,PMID:17259989,PMID:23028307,PMID... | 55 | 6.354672e-05 | B2M | MHCI | HLA-B*35 | B*35 EPL |
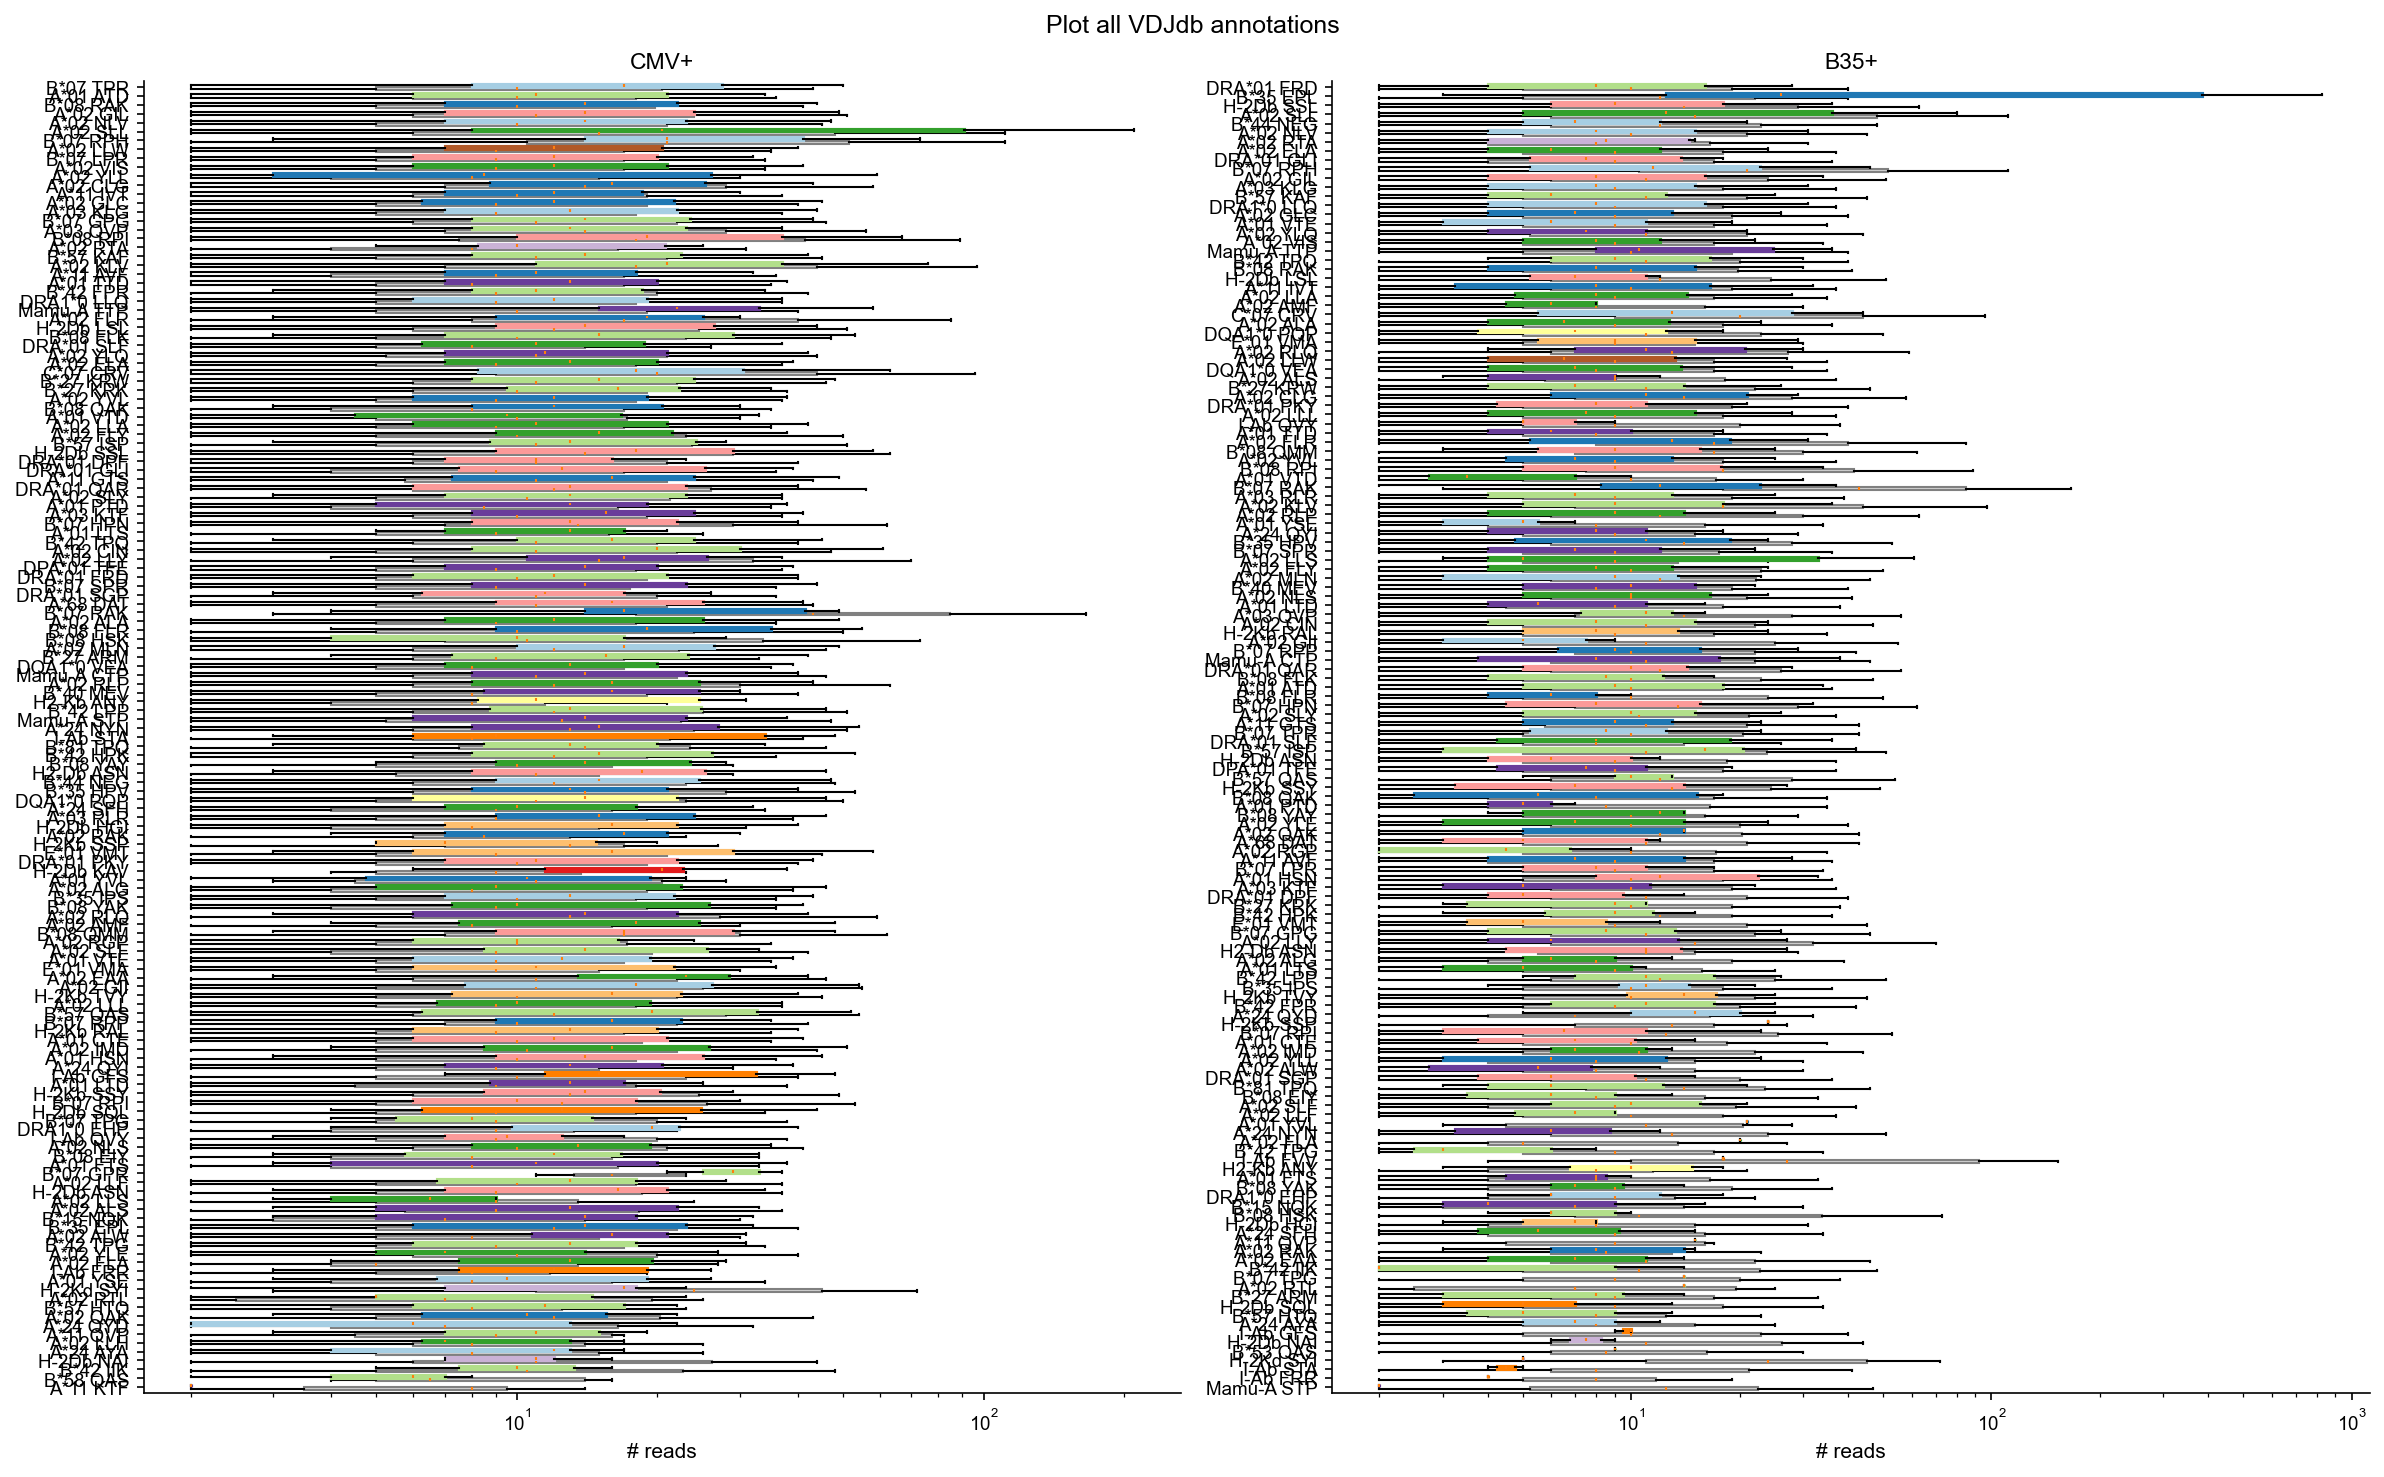
Plot all VDJdb annotations#
Overlay sample-specific annotation count distributions against the control repertoire background.
[5]:
plot_boxpanels(df_vdjdb, df_vdjdb_control, 'Plot all VDJdb annotations')
wilcox_by_epitope(df_vdjdb, df_vdjdb_control)
[5]:
| sample_id | epi.name | p.value | p.value.adj | |
|---|---|---|---|---|
| 182 | CMV+ | A*02 NLV | 9.674646e-59 | 2.815322e-56 |
| 198 | CMV+ | A*03 KLG | 2.029298e-56 | 2.952629e-54 |
| 37 | B35+ | A*02 NLV | 1.564193e-53 | 1.517267e-51 |
| 25 | B35+ | A*02 GIL | 1.283083e-31 | 9.334429e-30 |
| 169 | CMV+ | A*02 GIL | 1.273074e-17 | 7.409290e-16 |
| ... | ... | ... | ... | ... |
| 263 | CMV+ | DRA*01 QAR | 9.602773e-01 | 9.736610e-01 |
| 43 | B35+ | A*02 RTA | 9.812679e-01 | 9.914894e-01 |
| 152 | CMV+ | A*01 VTD | 1.000000e+00 | 1.000000e+00 |
| 60 | B35+ | A*11 QVP | 1.000000e+00 | 1.000000e+00 |
| 138 | B35+ | I-Ab GFS | 1.000000e+00 | 1.000000e+00 |
291 rows × 4 columns
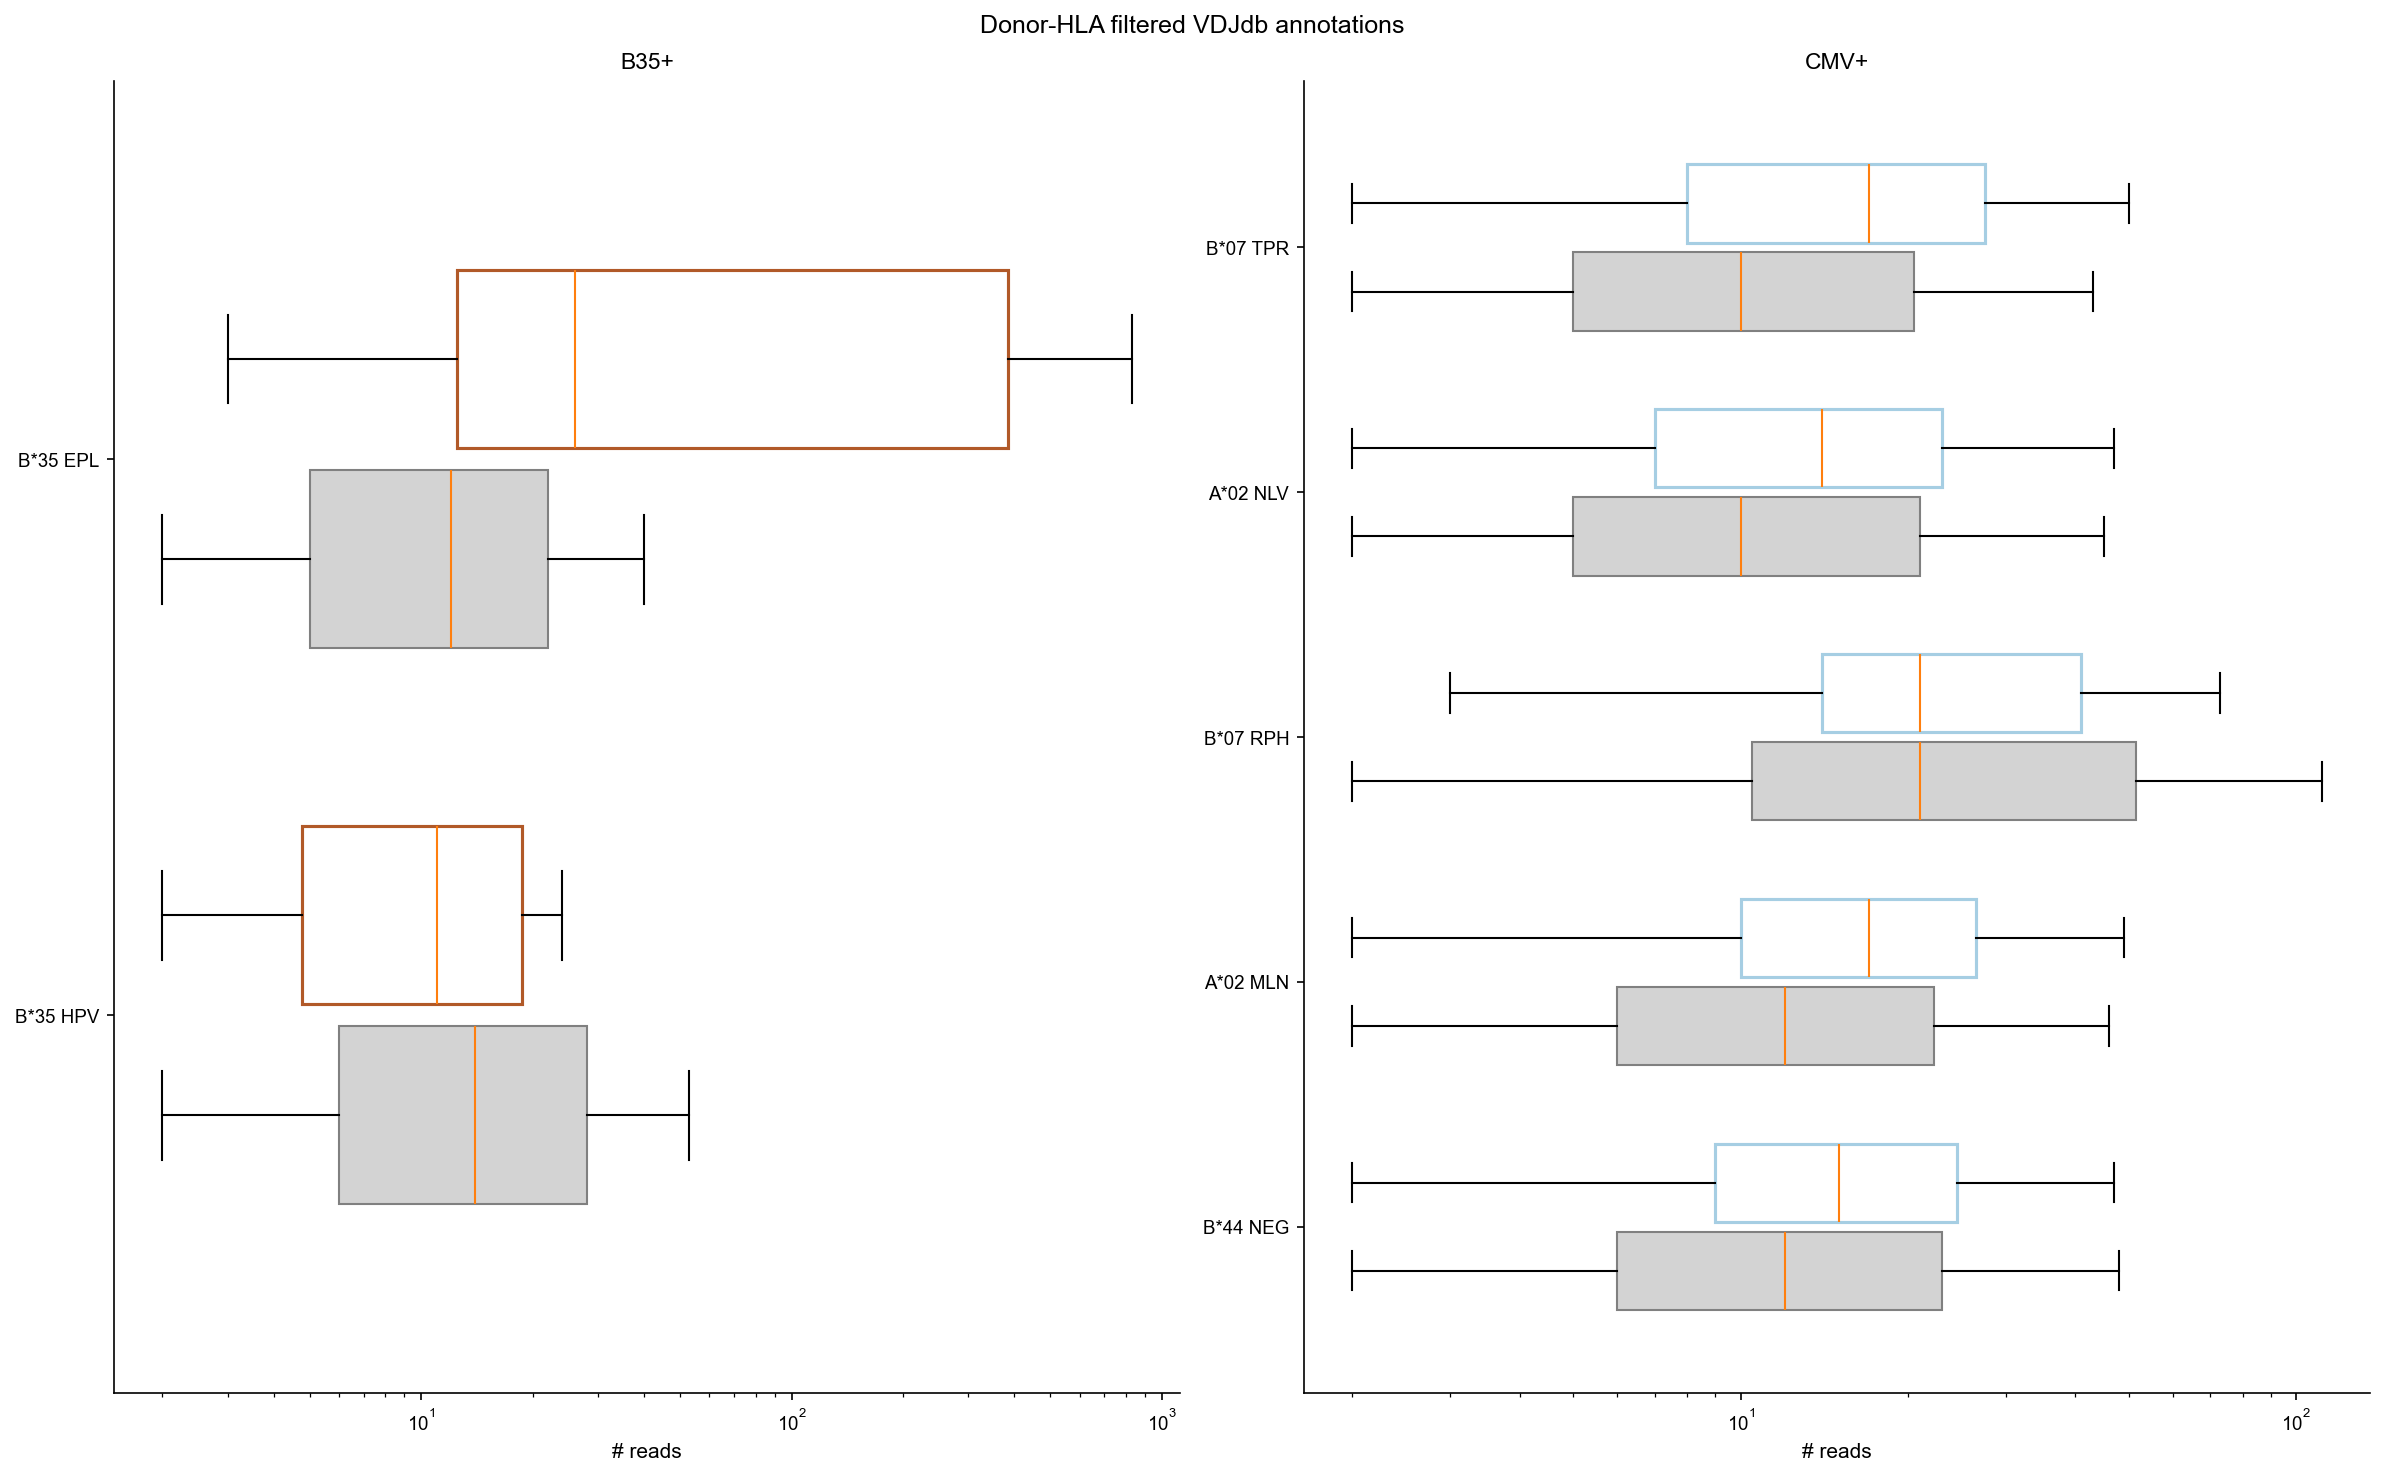
Zoom in and filter based on donor HLA haplotype knowledge#
For the CMV+ donor keep only CMV annotations compatible with donor HLA. For the B35+ donor keep only non-CMV annotations compatible with donor HLA.
[6]:
df_vdjdb_f = donor_filter(df_vdjdb)
df_vdjdb_c = donor_control_filter(df_vdjdb_control)

plot_boxpanels(df_vdjdb_f, df_vdjdb_c, 'Donor-HLA filtered VDJdb annotations')
wilcox_by_epitope(df_vdjdb_f, df_vdjdb_c)
[6]:
| sample_id | epi.name | p.value | p.value.adj | |
|---|---|---|---|---|
| 3 | CMV+ | A*02 NLV | 9.674646e-59 | 6.772252e-58 |
| 0 | B35+ | B*35 EPL | 1.162456e-04 | 2.856093e-04 |
| 5 | CMV+ | B*07 TPR | 1.224040e-04 | 2.856093e-04 |
| 2 | CMV+ | A*02 MLN | 9.842690e-03 | 1.722471e-02 |
| 6 | CMV+ | B*44 NEG | 2.828507e-02 | 3.959909e-02 |
| 1 | B35+ | B*35 HPV | 3.344690e-01 | 3.902138e-01 |
| 4 | CMV+ | B*07 RPH | 8.518887e-01 | 8.518887e-01 |
Search for expanded TCR groups with TCRNET#
Run TCRNET against the full control repertoire, adjust P-values, select enriched clonotypes, and compare fold enrichment with a synthetic control of size \(10^7\).
[7]:
cmv_tcrnet = compute_tcrnet(
    cmv_rep_full,
    control=control_rep_full,
    metric='hamming',
    threshold=1,
    match_mode='vj',
    pvalue_mode='binomial',
    n_jobs=CORES,
)
b35_tcrnet = compute_tcrnet(
    b35_rep_full,
    control=control_rep_full,
    metric='hamming',
    threshold=1,
    match_mode='vj',
    pvalue_mode='binomial',
    n_jobs=CORES,
)

df_tcrnet = pd.concat(
    [
        tcrnet_table_with_counts(cmv_rep_full, 'CMV+', cmv_tcrnet.table),
        tcrnet_table_with_counts(b35_rep_full, 'B35+', b35_tcrnet.table),
    ],
    ignore_index=True,
)
df_tcrnet_e = df_tcrnet[df_tcrnet['p.adj'].lt(0.05)].copy()
df_tcrnet_e.groupby('sample_id').agg(enriched_clonotypes=('cdr3aa', 'count'))
[7]:
| enriched_clonotypes | |
|---|---|
| sample_id | |
| B35+ | 371 |
| CMV+ | 126 |
Synthetic-control comparison#
This is the only analysis block added on top of the reference workflow: compare fold enrichment from the full control repertoire against a synthetic control of size \(10^7\).
[8]:
from mir.common.control import ControlManager
[ ]:
mgr = ControlManager()

synth_specs = {
    'CMV+': {'rep': cmv_rep_full, 'seed': 42},
    'B35+': {'rep': b35_rep_full, 'seed': 43},
}

synth_tables: list[pd.DataFrame] = []
for sample_id, spec in synth_specs.items():
    synth_path = mgr.synthetic_control_path('human', 'TRB', 10_000_000)
    if not synth_path.exists():
        print(f"Synthetic control cache missing for n=10^7 at {synth_path}; skipping synthetic comparison for {sample_id}.")
        continue

    synth_result = compute_tcrnet(
        spec['rep'],
        control_type='synthetic',
        species='human',
        control_manager=mgr,
        control_kwargs={'n': 10_000_000, 'seed': spec['seed'], 'chunk_size': 100_000, 'progress': True},
        normalize_control_vj_usage=True,
        metric='hamming',
        threshold=1,
        match_mode='vj',
        pvalue_mode='binomial',
        n_jobs=CORES,
    )
    synth_tables.append(tcrnet_table_with_counts(spec['rep'], sample_id, synth_result.table))

if synth_tables:
    df_tcrnet_synth = pd.concat(synth_tables, ignore_index=True)

    comparison = (
        df_tcrnet[['sample_id', 'cdr3aa', 'fold', 'p.adj']]
        .rename(columns={'fold': 'fold_real', 'p.adj': 'p_real'})
        .merge(
            df_tcrnet_synth[['sample_id', 'cdr3aa', 'fold', 'p.adj']].rename(columns={'fold': 'fold_synth', 'p.adj': 'p_synth'}),
            on=['sample_id', 'cdr3aa'],
            how='inner',
        )
    )

    ann_cols = ['sample_id', 'cdr3aa', 'antigen.epitope', 'mhc.a', 'mhc.b']
    ann_available = [c for c in ann_cols if c in df_vdjdb_f.columns]
    if ann_available:
        comparison = comparison.merge(df_vdjdb_f[ann_available].drop_duplicates(), on=['sample_id', 'cdr3aa'], how='left')

    epi = comparison.get('antigen.epitope', pd.Series('', index=comparison.index)).fillna('')
    mhc_b = comparison.get('mhc.b', pd.Series('', index=comparison.index)).fillna('')

    comparison['highlight'] = np.select(
        [
            comparison['sample_id'].eq('B35+') & epi.str.contains('EPL', na=False),
            comparison['sample_id'].eq('CMV+') & (epi.str.contains('TPR', na=False) | mhc_b.str.contains(r'B\*07', na=False, regex=True)),
        ],
        ['B35 EBV epitope', 'B07 CMV epitope'],
        default='other',
    )

    fig, axes = plt.subplots(1, 2, figsize=(14, 5), squeeze=False)
    for ax, sid in zip(axes[0], ['CMV+', 'B35+']):
        sub = comparison[comparison['sample_id'].eq(sid)].copy()
        if sub.empty:
            ax.set_title(f"{sid} (no synthetic-control overlap)")
            ax.set_axis_off()
            continue

        base = sub[sub['highlight'].eq('other')]
        if not base.empty:
            ax.scatter(base['fold_real'], base['fold_synth'], s=12, alpha=0.45, color='lightgray', label='other')

        palette = {'B35 EBV epitope': '#d62728', 'B07 CMV epitope': '#1f77b4'}
        for label, color in palette.items():
            h = sub[sub['highlight'].eq(label)]
            if h.empty:
                continue
            ax.scatter(h['fold_real'], h['fold_synth'], s=28, alpha=0.95, color=color, label=label)

        ax.set_xscale('log')
        ax.set_yscale('log')
        ax.set_xlabel('Fold enrichment vs real control')
        ax.set_ylabel('Fold enrichment vs synthetic control (10^7)')
        ax.set_title(sid)
        ax.legend(loc='best', fontsize=8)

    plt.tight_layout()
    plt.show()
else:
    print('Synthetic-control comparison skipped: no cached 10^7 synthetic control available.')
Synthetic control cache missing for n=10^7 at /Users/mikesh/.cache/mirpy/controls/synthetic/human/TRB/olga_n10000000.pkl; skipping synthetic comparison for CMV+.
Synthetic control cache missing for n=10^7 at /Users/mikesh/.cache/mirpy/controls/synthetic/human/TRB/olga_n10000000.pkl; skipping synthetic comparison for B35+.
Synthetic-control comparison skipped: no cached 10^7 synthetic control available.
<>:54: SyntaxWarning: invalid escape sequence '\*'
<>:54: SyntaxWarning: invalid escape sequence '\*'
/var/folders/w1/pqrcnlxn3ss93t6764fdgp1c0000gn/T/ipykernel_61407/2650750415.py:54: SyntaxWarning: invalid escape sequence '\*'
  comparison['sample_id'].eq('CMV+') & (epi.str.contains('TPR', na=False) | mhc_b.str.contains('B\*07', na=False, regex=True)),
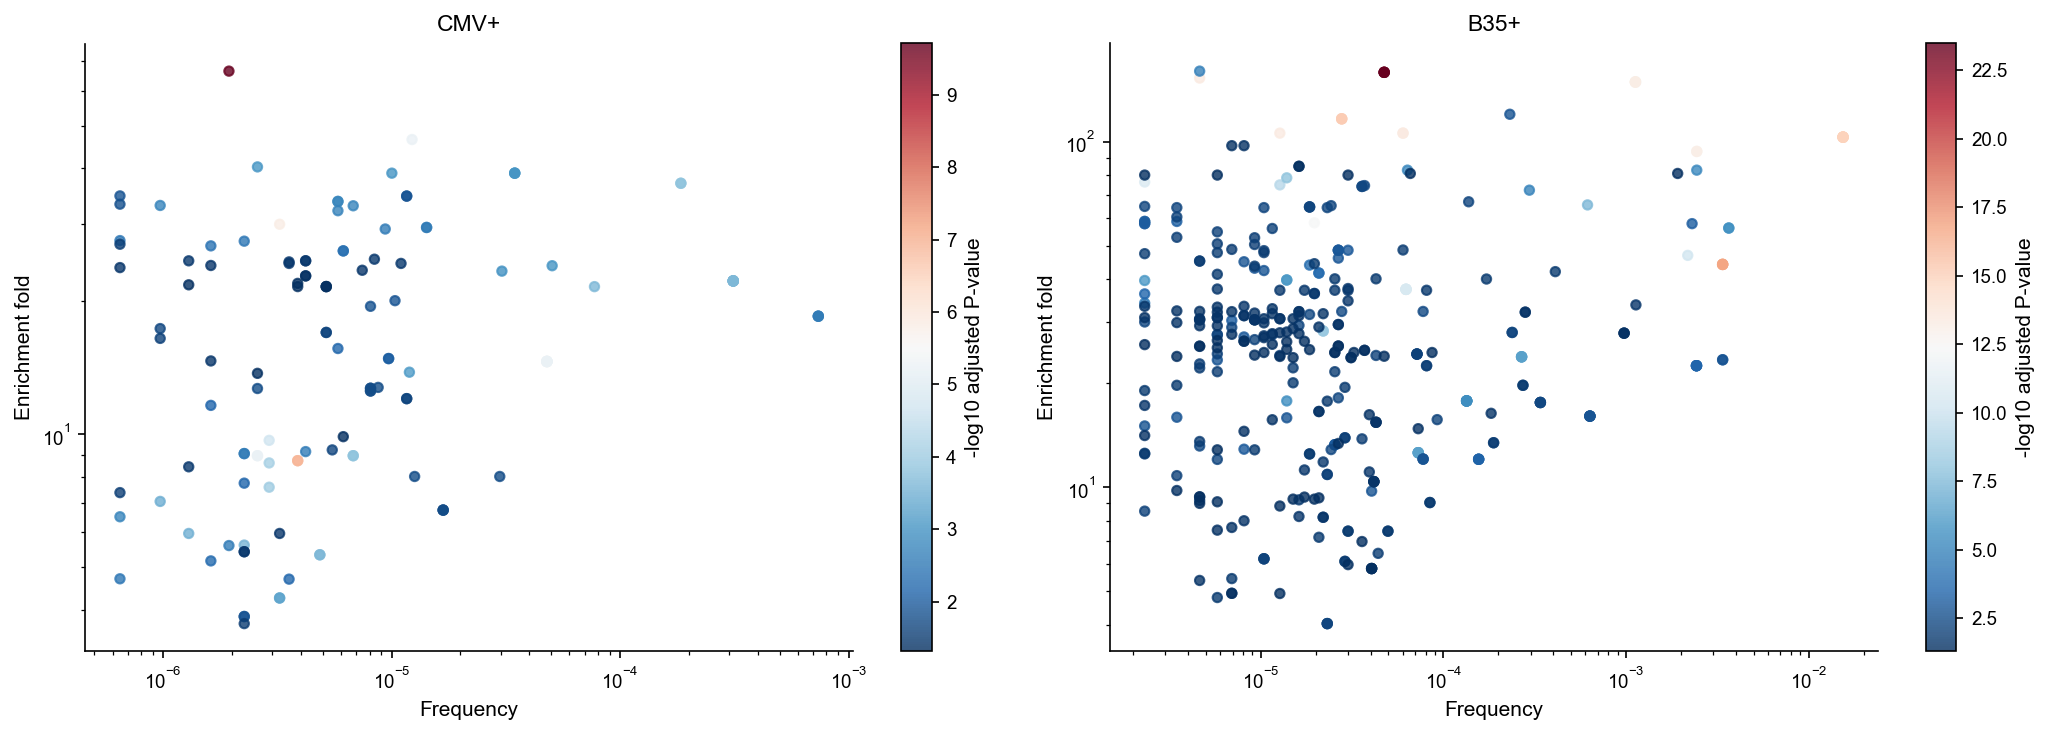
Correlation between enrichment fold and clonotype frequency#
Plot enriched clonotypes, coloring by adjusted significance.
[10]:
fig, axes = plt.subplots(1, 2, figsize=(14, 5), squeeze=False)
for ax, sample_id in zip(axes[0], ['CMV+', 'B35+']):
    sub = df_tcrnet_e[df_tcrnet_e['sample_id'].eq(sample_id)].copy()
    if sub.empty:
        continue
    scatter = ax.scatter(
        sub['freq'],
        sub['fold'],
        c=-np.log10(np.maximum(sub['p.adj'], 1e-300)),
        cmap='RdBu_r',
        s=20,
        alpha=0.8,
    )
    ax.set_xscale('log')
    ax.set_yscale('log')
    ax.set_xlabel('Frequency')
    ax.set_ylabel('Enrichment fold')
    ax.set_title(sample_id)
    plt.colorbar(scatter, ax=ax, label='-log10 adjusted P-value')
plt.tight_layout()
plt.show()

df_tcrnet_e.groupby('sample_id').apply(lambda x: pd.Series({'spearman_r': spearmanr(x['fold'], x['freq']).statistic, 'p_value': spearmanr(x['fold'], x['freq']).pvalue}))
[10]:
| spearman_r | p_value | |
|---|---|---|
| sample_id | ||
| B35+ | 0.013612 | 0.793849 |
| CMV+ | 0.244769 | 0.005740 |
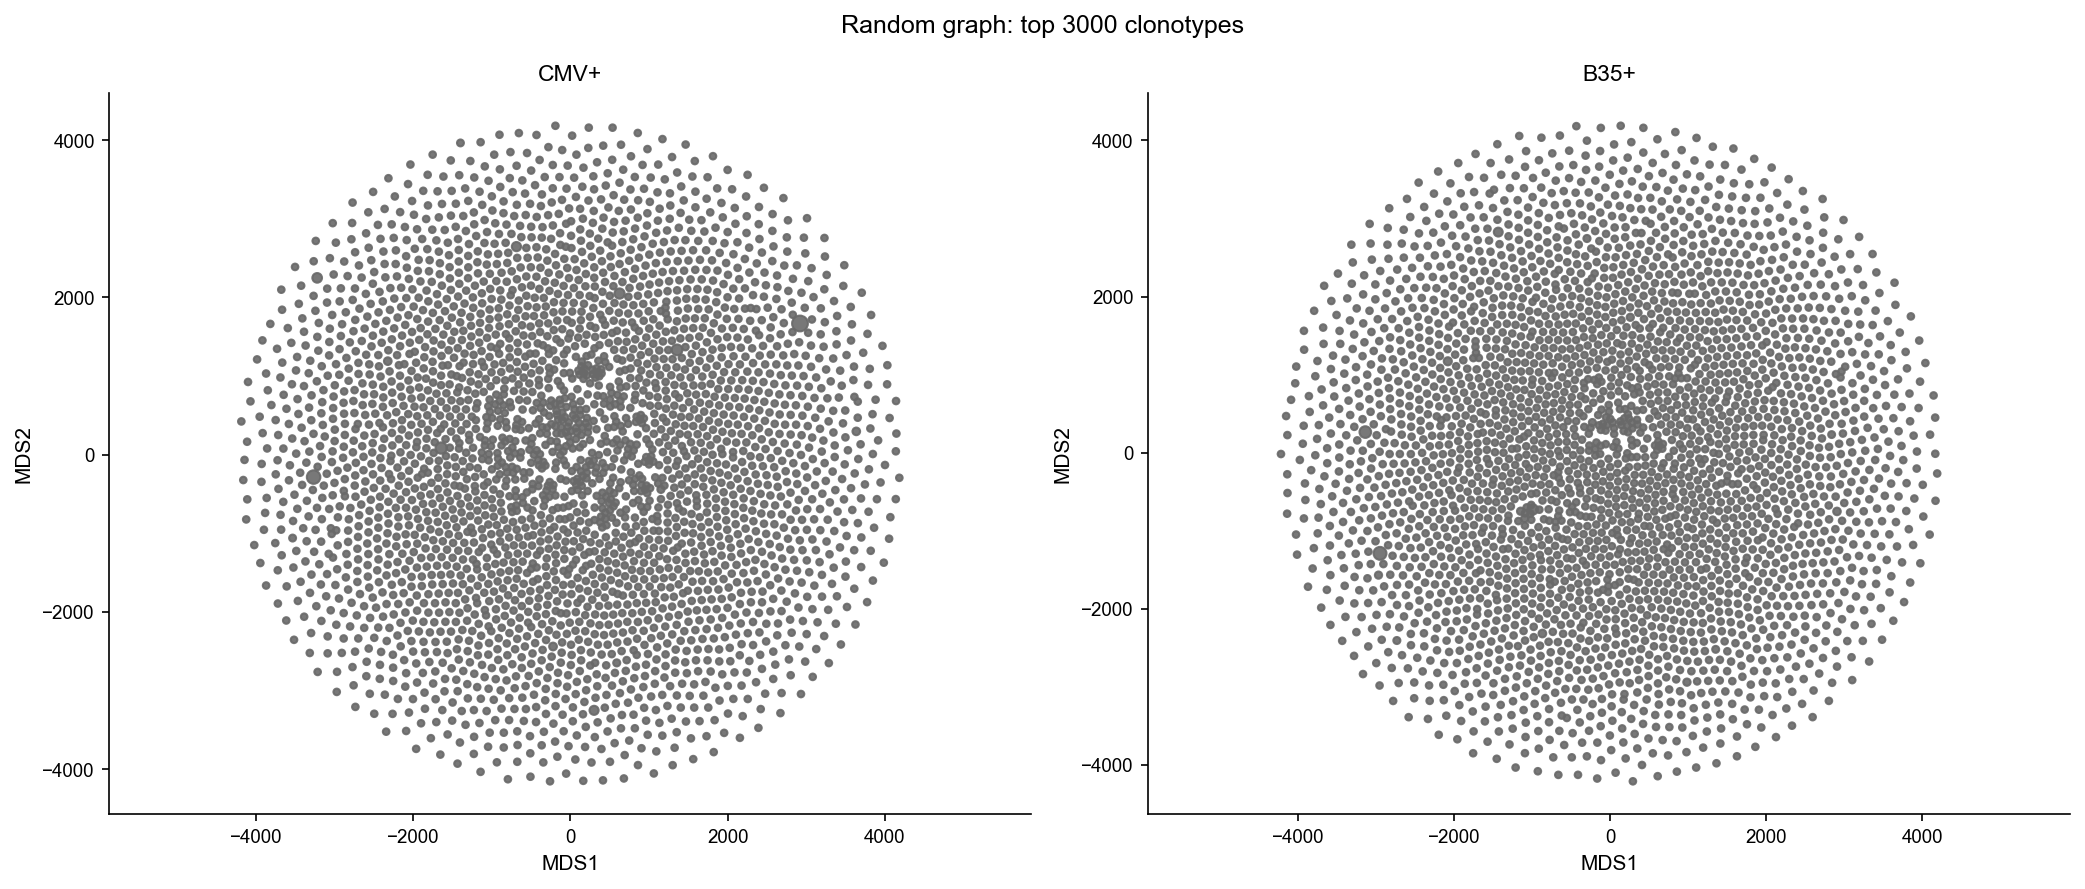
Extract enriched groups of homologous TCRs#
Compute Hamming-distance graphs for random top-3000 clonotypes and for the neighborhoods around enriched clonotypes.
[11]:
def layout_graph_df(node_df: pd.DataFrame, sample_id: str) -> pd.DataFrame:
    if node_df.empty:
        return pd.DataFrame(columns=['cdr3aa', 'x', 'y', 'cid', 'cid2', 'sample_id', 'freq', 'count'])
    graph = build_edit_distance_graph(sequences_to_clonotypes(node_df), metric='hamming', threshold=1, nproc=CORES)
    coords = np.asarray(graph.layout_graphopt(niter=3000, node_charge=0.005)) if graph.vcount() else np.empty((0, 2))
    membership = graph.components().membership if graph.vcount() else []
    layout = pd.DataFrame(
        {
            'cdr3aa': graph.vs['name'],
            'x': coords[:, 0] if len(coords) else [],
            'y': coords[:, 1] if len(coords) else [],
            'cid': membership,
            'sample_id': sample_id,
        }
    )
    layout['cid2'] = layout['sample_id'] + '_C' + layout['cid'].astype(str)
    return layout.merge(node_df[['cdr3aa', 'freq', 'count']].drop_duplicates(), on='cdr3aa', how='left')
[12]:
def plot_graph_panels(df_layout: pd.DataFrame, color_by: str | None, title: str, annotate_only: bool = False) -> None:
    sample_ids = list(df_layout['sample_id'].drop_duplicates())
    fig, axes = plt.subplots(1, len(sample_ids), figsize=(7 * len(sample_ids), 6), squeeze=False)
    for ax, sample_id in zip(axes[0], sample_ids):
        sub = df_layout[df_layout['sample_id'].eq(sample_id)].copy()
        if sub.empty:
            continue
        sizes = np.sqrt(sub['freq'].fillna(0).to_numpy() + 1e-12) * 200
        if annotate_only:
            ax.scatter(sub['x'], sub['y'], s=np.maximum(sizes, 10), color='lightgrey', alpha=0.35)
            colored = sub[sub[color_by].notna()].copy()
            if not colored.empty:
                for label, grp in colored.groupby(color_by):
                    ax.scatter(grp['x'], grp['y'], s=np.maximum(np.sqrt(grp['freq'].to_numpy() + 1e-12) * 220, 14), label=label, alpha=0.9)
                ax.legend(loc='lower center', bbox_to_anchor=(0.5, -0.22), ncol=2, fontsize=8)
        elif color_by is None:
            ax.scatter(sub['x'], sub['y'], s=np.maximum(sizes, 10), color='dimgray', alpha=0.9)
        else:
            ax.scatter(sub['x'], sub['y'], s=np.maximum(sizes, 10), c=sub[color_by], cmap='Set1', alpha=0.9)
        ax.set_title(sample_id)
        ax.set_xlabel('MDS1')
        ax.set_ylabel('MDS2')
        ax.set_aspect('equal', adjustable='datalim')
        ax.grid(False)
    fig.suptitle(title)
    plt.tight_layout()
    plt.show()
[13]:
sequence_tables = {
    'CMV+': repertoire_to_sequence_table(cmv_rep_full, 'CMV+'),
    'B35+': repertoire_to_sequence_table(b35_rep_full, 'B35+'),
}

random_layouts = []
enriched_layouts = []
for sample_id, rep in [('CMV+', cmv_rep_full), ('B35+', b35_rep_full)]:
    seq_table = sequence_tables[sample_id]
    rnd_nodes = (
        seq_table[~seq_table['cdr3aa'].str.contains(r'[_*]', regex=True, na=False)]
        .sort_values('count', ascending=False)
        .head(3000)
        .copy()
    )
    random_layouts.append(layout_graph_df(rnd_nodes, sample_id))

    enriched_seqs = df_tcrnet_e[df_tcrnet_e['sample_id'].eq(sample_id)]['cdr3aa'].drop_duplicates().tolist()
    neighbor_seqs = collect_neighbor_sequences(rep, enriched_seqs)
    enriched_nodes = seq_table[seq_table['cdr3aa'].isin(neighbor_seqs)].copy()
    enriched_layouts.append(layout_graph_df(enriched_nodes, sample_id))

df_mds_rnd = pd.concat(random_layouts, ignore_index=True)
df_mds = pd.concat(enriched_layouts, ignore_index=True)

df_mds[['sample_id', 'cid2']].drop_duplicates().groupby('sample_id').size().rename('n_components')
[13]:
sample_id
B35+    125
CMV+     43
Name: n_components, dtype: int64
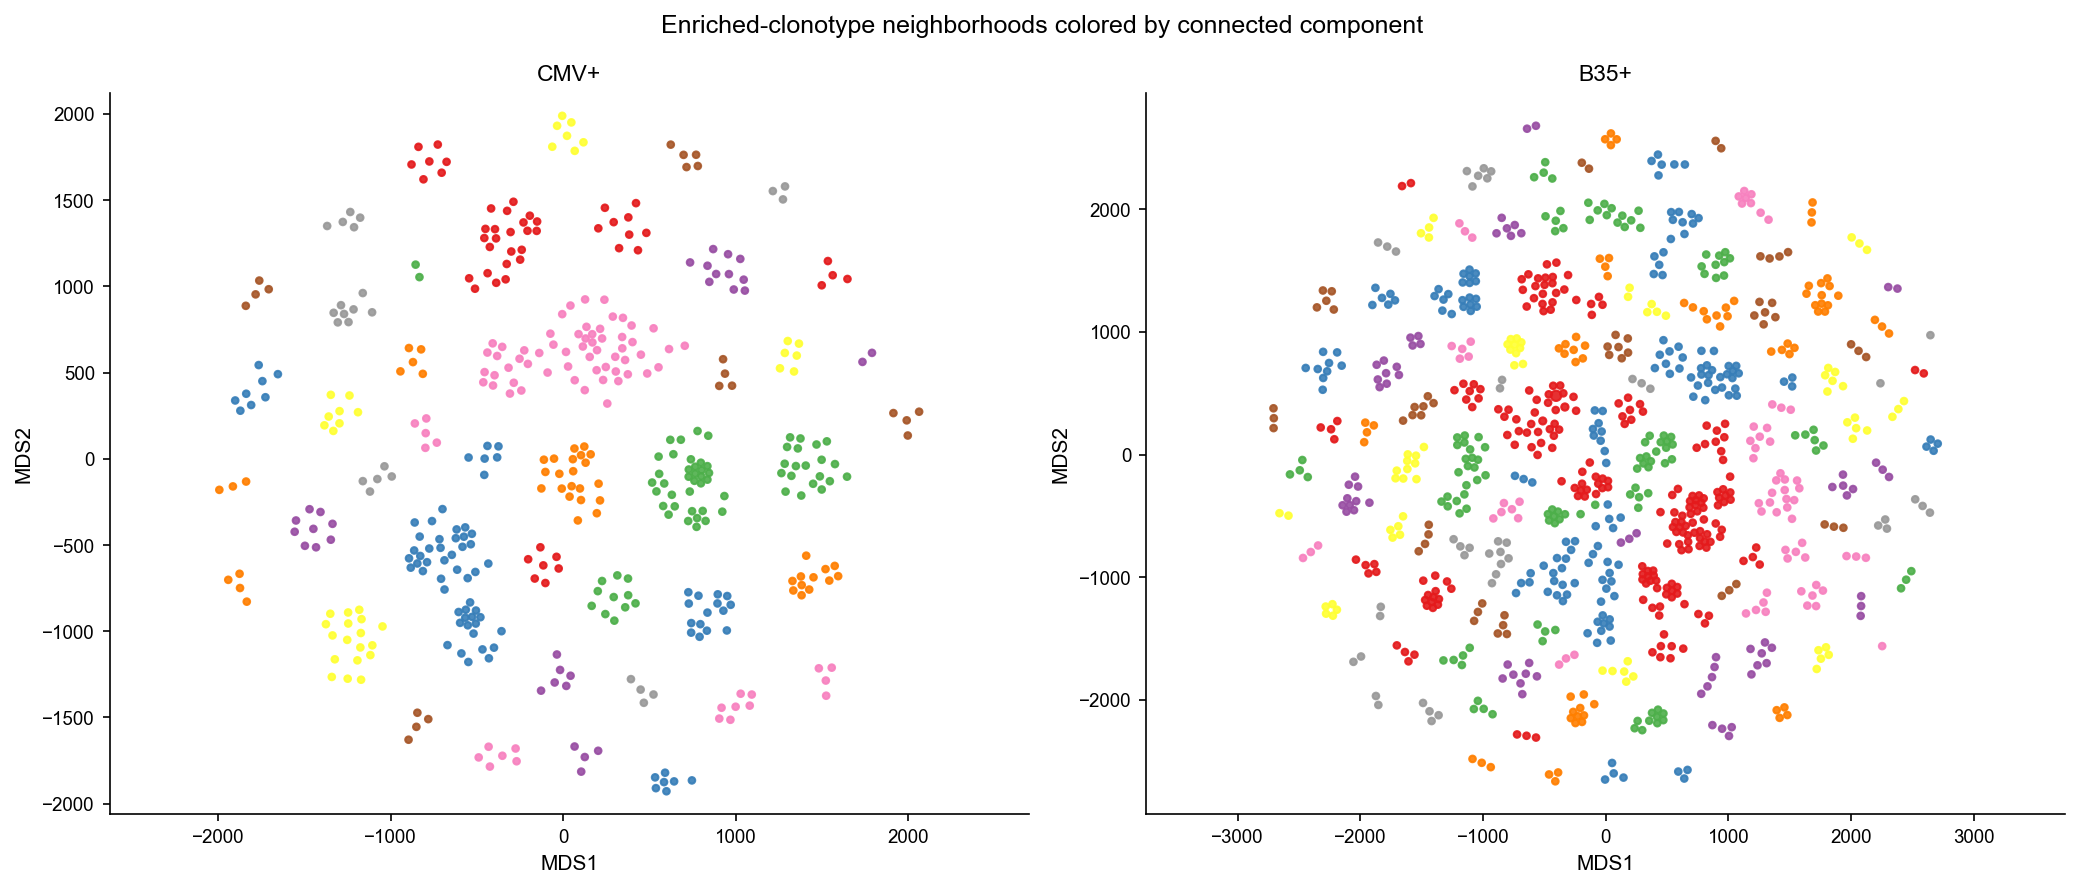
Layout and plot graphs#
Show the random top-3000 graph in grey and the enriched-neighborhood graph colored by connected component.
[14]:
plot_graph_panels(df_mds_rnd, color_by=None, title='Random graph: top 3000 clonotypes')
plot_graph_panels(df_mds, color_by='cid', title='Enriched-clonotype neighborhoods colored by connected component')
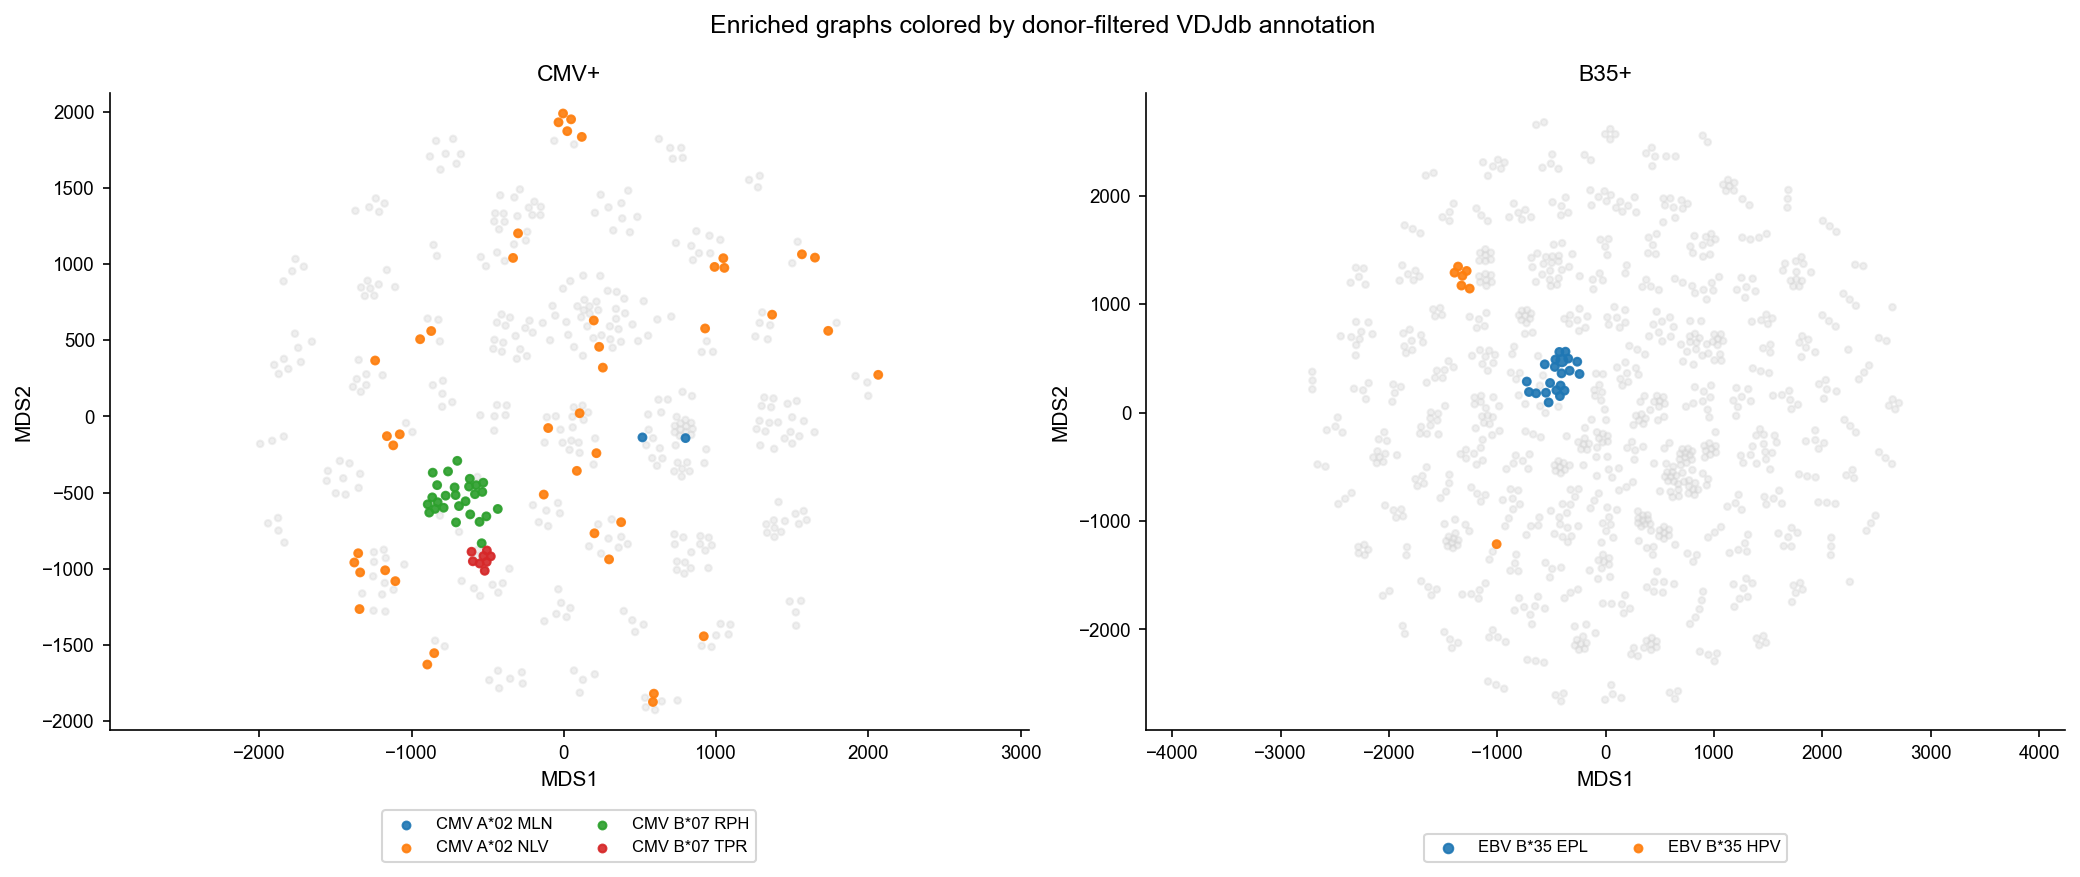
Combine TCRNET results and VDJdb annotations#
Color enriched-graph nodes by donor-filtered VDJdb annotations and compute annotation enrichment for connected components.
[15]:
annot_cols = df_vdjdb_f[['cdr3aa', 'epi.name', 'sample_id', 'antigen.species']].drop_duplicates().copy()
annot_cols['epi.name'] = annot_cols['antigen.species'].astype(str) + ' ' + annot_cols['epi.name'].astype(str)
annot_cols = annot_cols[['cdr3aa', 'epi.name', 'sample_id']]

df_mds_ag_freq = df_mds.merge(annot_cols, on=['cdr3aa', 'sample_id'], how='left')
plot_graph_panels(df_mds_ag_freq, color_by='epi.name', title='Enriched graphs colored by donor-filtered VDJdb annotation', annotate_only=True)

cluster_annot_stats = cluster_annotation_stats(df_mds_ag_freq)
cluster_annot_stats.head(20)
[15]:
| sample_id | cid2 | epi.name | total.sample | total.epi | total.cluster | count.matched | fraction.matched | fraction.matched.e | p.value | p.value.adj | |
|---|---|---|---|---|---|---|---|---|---|---|---|
| 0 | B35+ | B35+_C0 | EBV B*35 EPL | 885 | 21 | 40 | 21 | 0.525000 | 0.023729 | 6.457089e-24 | 1.614272e-22 |
| 22 | CMV+ | CMV+_C7 | CMV B*07 RPH | 444 | 27 | 47 | 27 | 0.574468 | 0.060811 | 4.291258e-21 | 5.364072e-20 |
| 1 | B35+ | B35+_C27 | EBV B*35 HPV | 885 | 7 | 20 | 6 | 0.300000 | 0.007910 | 8.629575e-09 | 7.191312e-08 |
| 23 | CMV+ | CMV+_C7 | CMV B*07 TPR | 444 | 8 | 47 | 8 | 0.170213 | 0.018018 | 1.865743e-06 | 1.166089e-05 |
| 12 | CMV+ | CMV+_C26 | CMV A*02 NLV | 444 | 44 | 7 | 5 | 0.714286 | 0.099099 | 1.689672e-04 | 8.448358e-04 |
| 13 | CMV+ | CMV+_C27 | CMV A*02 NLV | 444 | 44 | 18 | 6 | 0.333333 | 0.099099 | 6.136393e-03 | 2.556830e-02 |
| 21 | CMV+ | CMV+_C42 | CMV A*02 NLV | 444 | 44 | 5 | 3 | 0.600000 | 0.099099 | 8.342831e-03 | 2.979582e-02 |
| 3 | CMV+ | CMV+_C10 | CMV A*02 MLN | 444 | 2 | 36 | 2 | 0.055556 | 0.004505 | 1.154791e-02 | 3.608723e-02 |
| 2 | B35+ | B35+_C92 | EBV B*35 HPV | 885 | 7 | 3 | 1 | 0.333333 | 0.007910 | 2.354162e-02 | 6.539340e-02 |
| 14 | CMV+ | CMV+_C29 | CMV A*02 NLV | 444 | 44 | 4 | 2 | 0.500000 | 0.099099 | 5.142740e-02 | 1.168804e-01 |
| 7 | CMV+ | CMV+_C2 | CMV A*02 NLV | 444 | 44 | 4 | 2 | 0.500000 | 0.099099 | 5.142740e-02 | 1.168804e-01 |
| 8 | CMV+ | CMV+_C20 | CMV A*02 NLV | 444 | 44 | 5 | 2 | 0.400000 | 0.099099 | 8.015044e-02 | 1.565211e-01 |
| 4 | CMV+ | CMV+_C11 | CMV A*02 NLV | 444 | 44 | 11 | 3 | 0.272727 | 0.099099 | 8.765183e-02 | 1.565211e-01 |
| 5 | CMV+ | CMV+_C15 | CMV A*02 NLV | 444 | 44 | 11 | 3 | 0.272727 | 0.099099 | 8.765183e-02 | 1.565211e-01 |
| 24 | CMV+ | CMV+_C8 | CMV A*02 NLV | 444 | 44 | 7 | 2 | 0.285714 | 0.099099 | 1.474646e-01 | 2.318540e-01 |
| 9 | CMV+ | CMV+_C21 | CMV A*02 NLV | 444 | 44 | 21 | 4 | 0.190476 | 0.099099 | 1.483865e-01 | 2.318540e-01 |
| 6 | CMV+ | CMV+_C17 | CMV A*02 NLV | 444 | 44 | 2 | 1 | 0.500000 | 0.099099 | 1.883776e-01 | 2.770258e-01 |
| 19 | CMV+ | CMV+_C36 | CMV A*02 NLV | 444 | 44 | 58 | 3 | 0.051724 | 0.099099 | 2.775169e-01 | 3.854402e-01 |
| 16 | CMV+ | CMV+_C30 | CMV A*02 NLV | 444 | 44 | 4 | 1 | 0.250000 | 0.099099 | 3.412690e-01 | 4.265863e-01 |
| 17 | CMV+ | CMV+_C32 | CMV A*02 NLV | 444 | 44 | 4 | 1 | 0.250000 | 0.099099 | 3.412690e-01 | 4.265863e-01 |
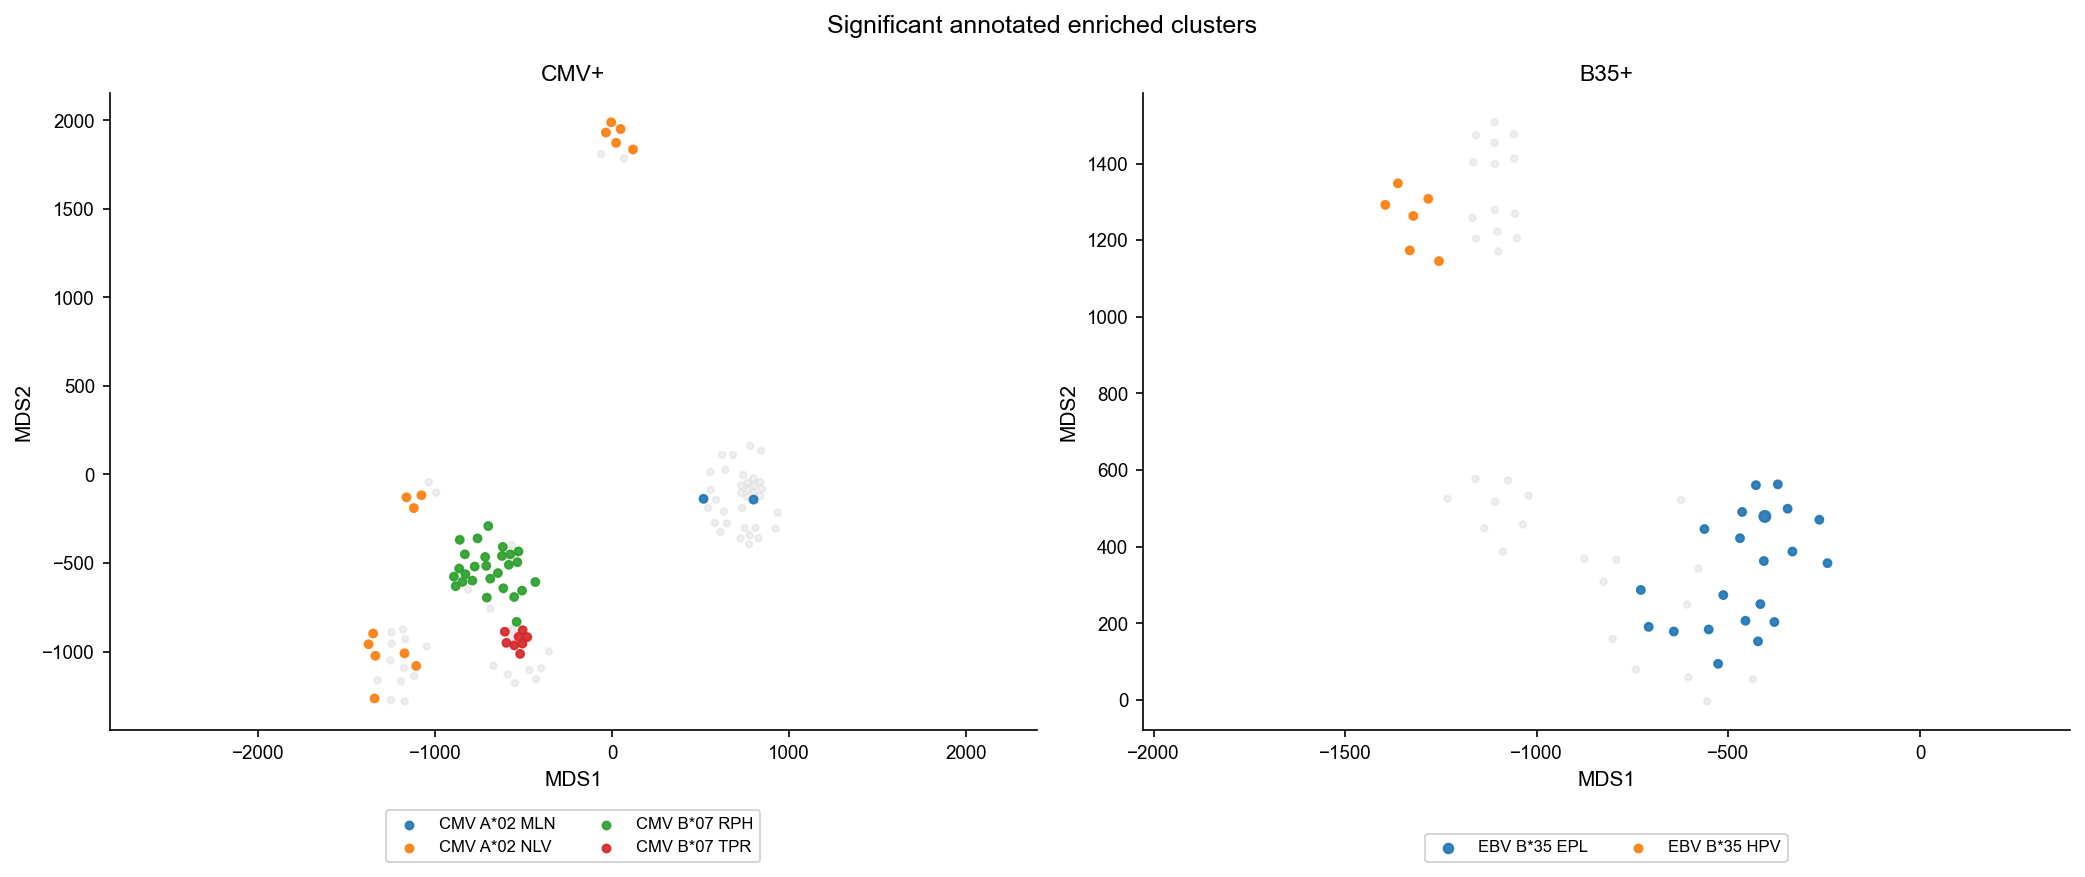
Interesting annotated clusters#
Inspect components with the strongest excess of donor-compatible VDJdb annotations and show the matched clonotypes.
[16]:
top_clusters = cluster_annot_stats[cluster_annot_stats['p.value.adj'].lt(0.05)].head(10).copy()
top_clusters

if not top_clusters.empty:
    interesting = df_mds_ag_freq[df_mds_ag_freq['cid2'].isin(top_clusters['cid2'])].copy()
    plot_graph_panels(interesting, color_by='epi.name', title='Significant annotated enriched clusters', annotate_only=True)
    display(
        interesting[
            ['sample_id', 'cid2', 'cdr3aa', 'count', 'freq', 'epi.name']
        ].sort_values(['sample_id', 'cid2', 'count'], ascending=[True, True, False]).head(50)
    )
| sample_id | cid2 | cdr3aa | count | freq | epi.name | |
|---|---|---|---|---|---|---|
| 448 | B35+ | B35+_C0 | CAIGTGDSNQPQHF | 13369 | 0.015446 | EBV B*35 EPL |
| 1189 | B35+ | B35+_C0 | CATSTGDSNQPQHF | 3165 | 0.003657 | EBV B*35 EPL |
| 1063 | B35+ | B35+_C0 | CASSTGDSNQPQHF | 2929 | 0.003384 | EBV B*35 EPL |
| 455 | B35+ | B35+_C0 | CAISTGDSNQPQHF | 2113 | 0.002441 | EBV B*35 EPL |
| 1171 | B35+ | B35+_C0 | CATGTGDSNQPQHF | 1886 | 0.002179 | EBV B*35 EPL |
| 465 | B35+ | B35+_C0 | CASGTGDSNQPQHF | 975 | 0.001127 | EBV B*35 EPL |
| 449 | B35+ | B35+_C0 | CAIGTGDTNQPQHF | 533 | 0.000616 | EBV B*35 EPL |
| 1062 | B35+ | B35+_C0 | CASSTGDNNQPQHF | 355 | 0.000410 | EBV B*35 EPL |
| 571 | B35+ | B35+_C0 | CASSEPYSNQPQHF | 232 | 0.000268 | NaN |
| 476 | B35+ | B35+_C0 | CASNTGDSNQPQHF | 206 | 0.000238 | EBV B*35 EPL |
| 1074 | B35+ | B35+_C0 | CASSTRDSNQPQHF | 135 | 0.000156 | NaN |
| 444 | B35+ | B35+_C0 | CAAGTGDSNQPQHF | 55 | 0.000064 | EBV B*35 EPL |
| 474 | B35+ | B35+_C0 | CASNQPYSNQPQHF | 52 | 0.000060 | NaN |
| 984 | B35+ | B35+_C0 | CASSQPYSNQPQHF | 41 | 0.000047 | NaN |
| 1192 | B35+ | B35+_C0 | CATWTGDSNQPQHF | 28 | 0.000032 | EBV B*35 EPL |
| 463 | B35+ | B35+_C0 | CASGQPYSNQPQHF | 24 | 0.000028 | NaN |
| 715 | B35+ | B35+_C0 | CASSLGDSNQPQHF | 24 | 0.000028 | EBV B*35 EPL |
| 1070 | B35+ | B35+_C0 | CASSTGVDNQPQHF | 24 | 0.000028 | NaN |
| 531 | B35+ | B35+_C0 | CASSAGDSNQPQHF | 21 | 0.000024 | EBV B*35 EPL |
| 894 | B35+ | B35+_C0 | CASSPGYSNQPQHF | 21 | 0.000024 | NaN |
| 979 | B35+ | B35+_C0 | CASSQGYSNQPQHF | 19 | 0.000022 | NaN |
| 1061 | B35+ | B35+_C0 | CASSTGDGNQPQHF | 19 | 0.000022 | EBV B*35 EPL |
| 1059 | B35+ | B35+_C0 | CASSTGAGNQPQHF | 18 | 0.000021 | NaN |
| 1165 | B35+ | B35+_C0 | CASTQPYSNQPQHF | 17 | 0.000020 | NaN |
| 473 | B35+ | B35+_C0 | CASNEGDSNQPQHF | 16 | 0.000018 | NaN |
| 530 | B35+ | B35+_C0 | CASSAGDGNQPQHF | 16 | 0.000018 | NaN |
| 593 | B35+ | B35+_C0 | CASSFGDSNQPQHF | 15 | 0.000017 | EBV B*35 EPL |
| 1068 | B35+ | B35+_C0 | CASSTGTGNQPQHF | 12 | 0.000014 | NaN |
| 1190 | B35+ | B35+_C0 | CATSTGDVNQPQHF | 12 | 0.000014 | EBV B*35 EPL |
| 446 | B35+ | B35+_C0 | CAGGTGDSNQPQHF | 11 | 0.000013 | EBV B*35 EPL |
| 838 | B35+ | B35+_C0 | CASSNPYSNQPQHF | 11 | 0.000013 | NaN |
| 1162 | B35+ | B35+_C0 | CASTNPYSNQPQHF | 10 | 0.000012 | NaN |
| 445 | B35+ | B35+_C0 | CAGGQPYSNQPQHF | 9 | 0.000010 | NaN |
| 1071 | B35+ | B35+_C0 | CASSTGVSNQPQHF | 7 | 0.000008 | EBV B*35 EPL |
| 1095 | B35+ | B35+_C0 | CASSVGVSNQPQHF | 7 | 0.000008 | NaN |
| 1060 | B35+ | B35+_C0 | CASSTGASNQPQHF | 6 | 0.000007 | EBV B*35 EPL |
| 1072 | B35+ | B35+_C0 | CASSTGYSNQPQHF | 6 | 0.000007 | EBV B*35 EPL |
| 635 | B35+ | B35+_C0 | CASSHGYSNQPQHF | 5 | 0.000006 | NaN |
| 1128 | B35+ | B35+_C0 | CASSYGDNNQPQHF | 5 | 0.000006 | NaN |
| 999 | B35+ | B35+_C0 | CASSRGDSNQPQHF | 3 | 0.000003 | EBV B*35 EPL |
| 1067 | B35+ | B35+_C27 | CASSTGTGELFF | 107 | 0.000124 | NaN |
| 541 | B35+ | B35+_C27 | CASSARTGELFF | 67 | 0.000077 | EBV B*35 HPV |
| 1100 | B35+ | B35+_C27 | CASSVRTGELFF | 63 | 0.000073 | EBV B*35 HPV |
| 1145 | B35+ | B35+_C27 | CASSYGTGELFF | 54 | 0.000062 | NaN |
| 1098 | B35+ | B35+_C27 | CASSVNTGELFF | 38 | 0.000044 | NaN |
| 598 | B35+ | B35+_C27 | CASSFGTGELFF | 32 | 0.000037 | NaN |
| 1042 | B35+ | B35+_C27 | CASSSNTGELFF | 25 | 0.000029 | NaN |
| 761 | B35+ | B35+_C27 | CASSLGTGELFF | 22 | 0.000025 | NaN |
| 973 | B35+ | B35+_C27 | CASSQGTGELFF | 22 | 0.000025 | NaN |
| 1002 | B35+ | B35+_C27 | CASSRGTGELFF | 20 | 0.000023 | NaN |