Token Graph: Clonotypes × Tokens#
Builds a bipartite graph from GILGFVFTL-specific TRB CDR3 clonotypes where:
Clonotype nodes — one per unique CDR3 sequence.
Token nodes — one per unique annotated 3-mer.
An edge connects a clonotype to every token appearing in its CDR3.
The notebook shows the full graph (one giant CC) before applying the RS filter, highlighting which nodes are retained versus removed, then shows the RS-filtered cluster.
[1]:
import importlib.metadata as _meta
import sys as _sys
print(f"Python {_sys.version.split()[0]}")
for _pkg in ["mirpy-lib", "numpy", "pandas", "matplotlib", "scipy", "polars"]:
    try:
        print(f"  {_pkg}: {_meta.version(_pkg)}")
    except _meta.PackageNotFoundError:
        pass

# Import dependencies and configure project-local imports.
import sys
from pathlib import Path

import igraph as ig
import matplotlib.pyplot as plt
import matplotlib.patches as mpatches
import pandas as pd

repo_root = Path.cwd().resolve().parent if Path.cwd().name == "notebooks" else Path.cwd().resolve()
if str(repo_root) not in sys.path:
    sys.path.insert(0, str(repo_root))

from mir.common.clonotype import Clonotype
from mir.basic.token_tables import (
    filter_token_table,
    tokenize_clonotypes,
 )
from mir.graph.token_graph import build_token_graph
from mir.utils.notebook_assets import ensure_airr_benchmark, find_airr_benchmark_vdjdb_slim

# Publication-quality matplotlib style (Nature/Science aesthetics)
plt.rcParams.update({
    "font.family": "sans-serif",
    "font.sans-serif": ["Arial", "Helvetica", "DejaVu Sans"],
    "font.size": 10,
    "axes.titlesize": 11,
    "axes.labelsize": 10,
    "xtick.labelsize": 9,
    "ytick.labelsize": 9,
    "legend.fontsize": 9,
    "figure.dpi": 150,
    "savefig.dpi": 300,
    "axes.linewidth": 0.8,
    "axes.spines.top": False,
    "axes.spines.right": False,
    "xtick.major.size": 3.5,
    "ytick.major.size": 3.5,
    "xtick.direction": "out",
    "ytick.direction": "out",
    "axes.grid": False,
})
Python 3.12.12
  mirpy-lib: 1.1.0
  numpy: 1.26.4
  pandas: 3.0.3
  matplotlib: 3.10.9
  scipy: 1.17.1
  polars: 1.40.1
/Users/mikesh/vcs/mirpy/.venv/lib/python3.12/site-packages/tqdm/auto.py:21: TqdmWarning: IProgress not found. Please update jupyter and ipywidgets. See https://ipywidgets.readthedocs.io/en/stable/user_install.html
  from .autonotebook import tqdm as notebook_tqdm
1. Load data and build token tables#
[2]:
# Load VDJdb subset, construct clonotypes, and build token tables.
benchmark_root = ensure_airr_benchmark(repo_root, allow_patterns=["vdjdb/**"])
vdjdb_path = find_airr_benchmark_vdjdb_slim(benchmark_root)
vdjdb = pd.read_csv(vdjdb_path, sep="\t")

mask = vdjdb["gene"].eq("TRB") & vdjdb["antigen.epitope"].eq("GILGFVFTL")
if "species" in vdjdb.columns:
    mask &= vdjdb["species"].eq("HomoSapiens")
if "mhc.a" in vdjdb.columns:
    mask &= vdjdb["mhc.a"].fillna("").str.contains("A*02", regex=False)

cdr3s = sorted(vdjdb.loc[mask, "cdr3"].dropna().astype(str).unique())
K = 3

clonotypes = [
    Clonotype(
        sequence_id=str(i),
        locus="TRB",
        v_gene="TRBV",
        j_gene="TRBJ",
        junction_aa=seq,
        duplicate_count=1,
    )
    for i, seq in enumerate(cdr3s)
]

table = tokenize_clonotypes(clonotypes, k=K)
rs_table = filter_token_table(table, kmer_pattern="RS")

rs_token_seqs = {k.seq.decode() for k in rs_table}

print(f"Loaded {len(clonotypes)} clonotypes from {vdjdb_path}")
print(f"Sequences      : {len(clonotypes)}  ({sum('RS' in s for s in cdr3s)} with RS)")
print(f"Total {K}-tokens : {len(table)}")
print(f"RS {K}-tokens    : {len(rs_table)}  {sorted(rs_token_seqs)}")
Loaded 5236 clonotypes from /Users/mikesh/vcs/mirpy/notebooks/assets/large/airr_benchmark/vdjdb/vdjdb-2025-12-29/vdjdb.slim.txt.gz
Sequences      : 5236  (680 with RS)
Total 3-tokens : 4148
RS 3-tokens    : 38  ['ARS', 'DRS', 'ERS', 'FRS', 'GRS', 'HRS', 'IRS', 'KRS', 'LRS', 'MRS', 'NRS', 'PRS', 'QRS', 'RRS', 'RSA', 'RSD', 'RSE', 'RSF', 'RSG', 'RSH', 'RSI', 'RSK', 'RSL', 'RSM', 'RSN', 'RSP', 'RSQ', 'RSR', 'RSS', 'RST', 'RSV', 'RSW', 'RSY', 'SRS', 'TRS', 'VRS', 'WRS', 'YRS']
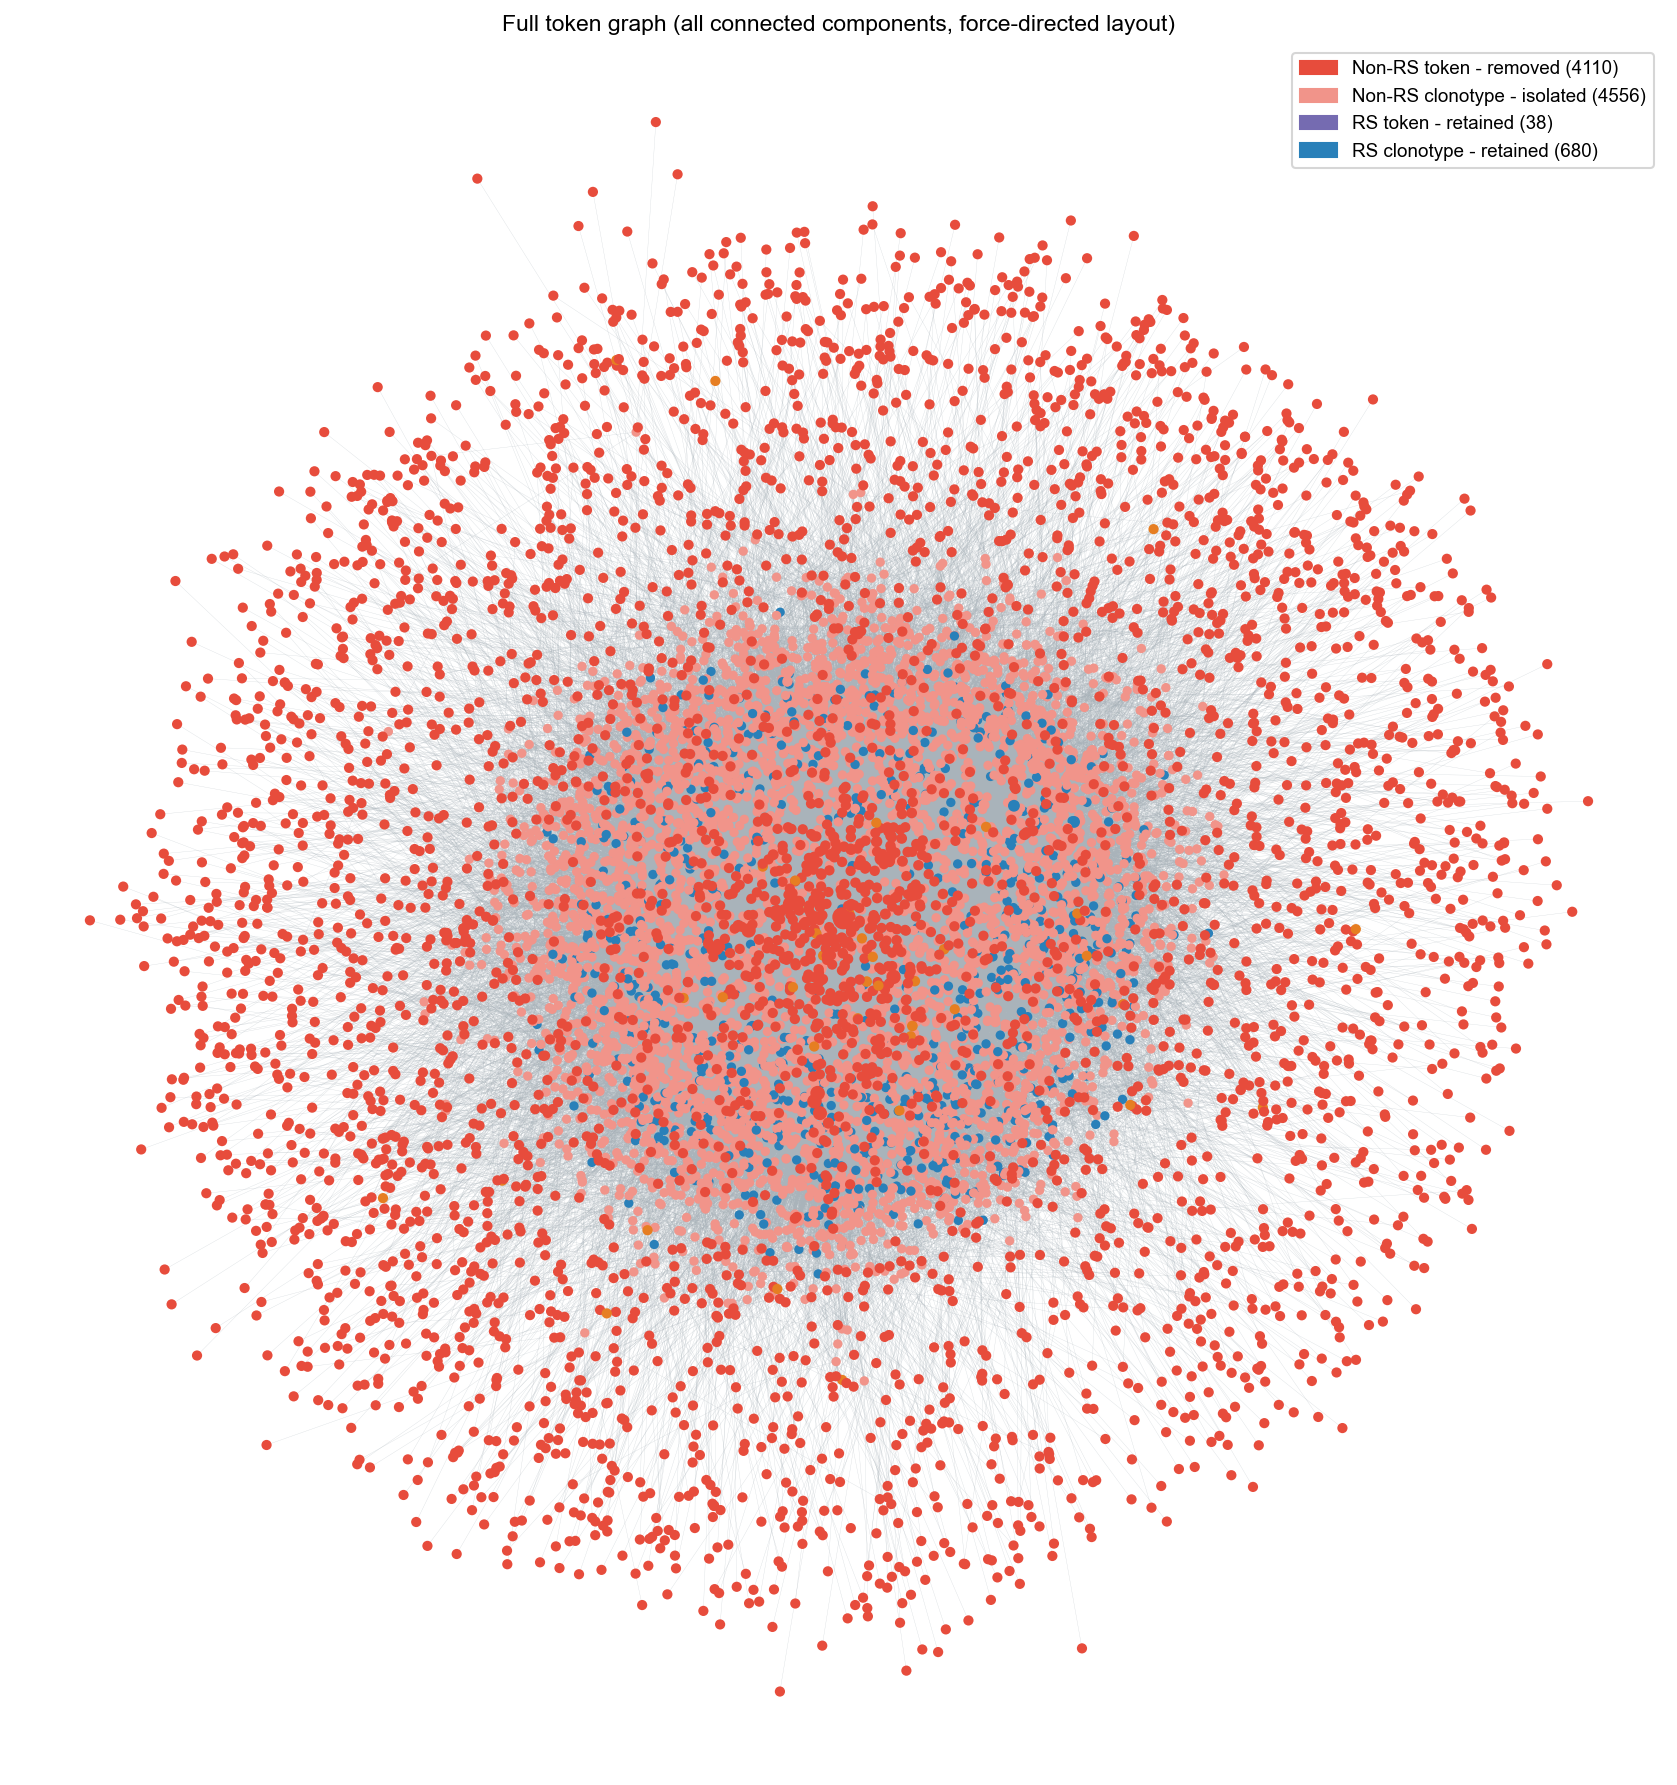
2. Full graph summary#
All CDR3s share common non-RS tokens (for example CAS, ASS), so the full token graph forms a single giant CC. After RS filtering, non-RS clonotypes become isolated singletons and non-RS tokens are removed from the graph.
[3]:
# Build full and RS-filtered token graphs and summarize retained node counts.
g_full = build_token_graph(clonotypes, table)
g_rs = build_token_graph(clonotypes, rs_table)

full_cc = g_full.components().giant()
filt_cc = g_rs.components().giant()

# Sets of junction_aa in filtered CC (to label retained nodes in full CC)
retained_r = {v["name"] for v in filt_cc.vs if v["node_type"] == "rearrangement"}
retained_k = {v["name"] for v in filt_cc.vs if v["node_type"] == "kmer"}

n_full_r = sum(1 for v in full_cc.vs if v["node_type"] == "rearrangement")
n_full_k = sum(1 for v in full_cc.vs if v["node_type"] == "kmer")
n_nonrs_r = sum(1 for v in full_cc.vs if v["node_type"] == "rearrangement" and v["name"] not in retained_r)
n_nonrs_k = sum(1 for v in full_cc.vs if v["node_type"] == "kmer" and v["name"] not in retained_k)
n_rs_r = len(retained_r)
n_rs_k = len(retained_k)

print(f"Full CC : {full_cc.vcount()} nodes  ({n_full_r} clonotypes, {n_full_k} tokens)")
print(f"  -> removed by RS filter : {n_nonrs_r} clonotypes + {n_nonrs_k} tokens")
print(f"  -> retained by RS filter: {n_rs_r} clonotypes + {n_rs_k} tokens")
print(f"RS-filtered giant CC: {filt_cc.vcount()} nodes  ({n_rs_r} clonotypes, {n_rs_k} tokens)")
Full CC : 9384 nodes  (5236 clonotypes, 4148 tokens)
  -> removed by RS filter : 4556 clonotypes + 4110 tokens
  -> retained by RS filter: 680 clonotypes + 38 tokens
RS-filtered giant CC: 718 nodes  (680 clonotypes, 38 tokens)
3. Full force-directed layout with top-degree highlights#
Colour meaning in the full graph (before filtering):
Colour |
Meaning |
|---|---|
Red |
Non-RS token - removed by RS filtering |
Salmon |
Non-RS clonotype - isolated by RS filtering |
Orange |
RS token - retained |
Blue |
RS clonotype - retained |
Only the top 10 clonotypes and top 10 tokens by degree are highlighted and labelled to keep the plot readable.
[4]:
# Visualize all connected components of the full graph with a packed force-directed layout.
subg = g_full
degrees = subg.degree()

top_n = 10
clonotype_idx = [v.index for v in subg.vs if v["node_type"] == "rearrangement"]
token_idx = [v.index for v in subg.vs if v["node_type"] == "kmer"]

ordered_clonotypes = sorted(clonotype_idx, key=lambda i: (-degrees[i], subg.vs[i]["name"]))
ordered_tokens = sorted(token_idx, key=lambda i: (-degrees[i], subg.vs[i]["name"]))

top_clonotype_idx = set(ordered_clonotypes[:top_n])
top_token_idx = set(ordered_tokens[:top_n])
highlight_idx = top_clonotype_idx | top_token_idx

max_deg = max(1, max(degrees))

# Compute component-aware coordinates: FR inside each component, then pack components into a grid.
components = [list(comp) for comp in subg.components()]
component_blocks = []
for comp_vertices in components:
    if len(comp_vertices) == 1:
        coords_local = [(0.0, 0.0)]
        width = 1.0
        height = 1.0
    else:
        comp_sub = subg.subgraph(comp_vertices)
        local_layout = comp_sub.layout("fr").coords
        xs = [c[0] for c in local_layout]
        ys = [c[1] for c in local_layout]
        min_x, max_x = min(xs), max(xs)
        min_y, max_y = min(ys), max(ys)
        width = max(1.0, max_x - min_x)
        height = max(1.0, max_y - min_y)
        coords_local = [(c[0] - min_x, c[1] - min_y) for c in local_layout]

    component_blocks.append(
        {
            "vertices": comp_vertices,
            "coords": coords_local,
            "width": width,
            "height": height,
        }
    )

component_blocks.sort(key=lambda d: len(d["vertices"]), reverse=True)
max_w = max(block["width"] for block in component_blocks)
max_h = max(block["height"] for block in component_blocks)
cols = max(1, int(len(component_blocks) ** 0.5))
gap = 4.0

x = [0.0] * subg.vcount()
y = [0.0] * subg.vcount()
for rank, block in enumerate(component_blocks):
    row = rank // cols
    col = rank % cols
    off_x = col * (max_w + gap)
    off_y = -row * (max_h + gap)
    for idx_local, v_idx in enumerate(block["vertices"]):
        cx, cy = block["coords"][idx_local]
        x[v_idx] = cx + off_x
        y[v_idx] = cy + off_y

vertex_colors = []
vertex_sizes = []
for v in subg.vs:
    is_token = v["node_type"] == "kmer"
    is_rs = v["name"] in (retained_k if is_token else retained_r)
    is_top = v.index in highlight_idx

    if is_token:
        vertex_colors.append("#e67e22" if is_rs else "#e74c3c")
        base = 24.0 + 56.0 * (degrees[v.index] / max_deg)
    else:
        vertex_colors.append("#2980b9" if is_rs else "#f1948a")
        base = 20.0 + 52.0 * (degrees[v.index] / max_deg)

    vertex_sizes.append(base + (12.0 if is_top else 0.0))

fig, ax = plt.subplots(figsize=(12, 12))
for e in subg.es:
    s, t = e.source, e.target
    ax.plot([x[s], x[t]], [y[s], y[t]], color="#a9b3ba", linewidth=0.15, alpha=0.5, zorder=1)

ax.scatter(
    x,
    y,
    s=vertex_sizes,
    c=vertex_colors,
    edgecolors="none",
    linewidths=0.0,
    zorder=2,
)

legend_handles = [
    mpatches.Patch(color="#e74c3c", label=f"Non-RS token - removed ({n_nonrs_k})"),
    mpatches.Patch(color="#f1948a", label=f"Non-RS clonotype - isolated ({n_nonrs_r})"),
    mpatches.Patch(color="#756bb1", label=f"RS token - retained ({len(retained_k)})"),
    mpatches.Patch(color="#2980b9", label=f"RS clonotype - retained ({len(retained_r)})"),
]
ax.legend(handles=legend_handles, loc="upper right", fontsize=9)
ax.set_title(
    f"Full token graph (all connected components, force-directed layout)",
    fontsize=11,
)
ax.set_aspect("equal", adjustable="box")
ax.axis("off")
plt.tight_layout()
plt.show()
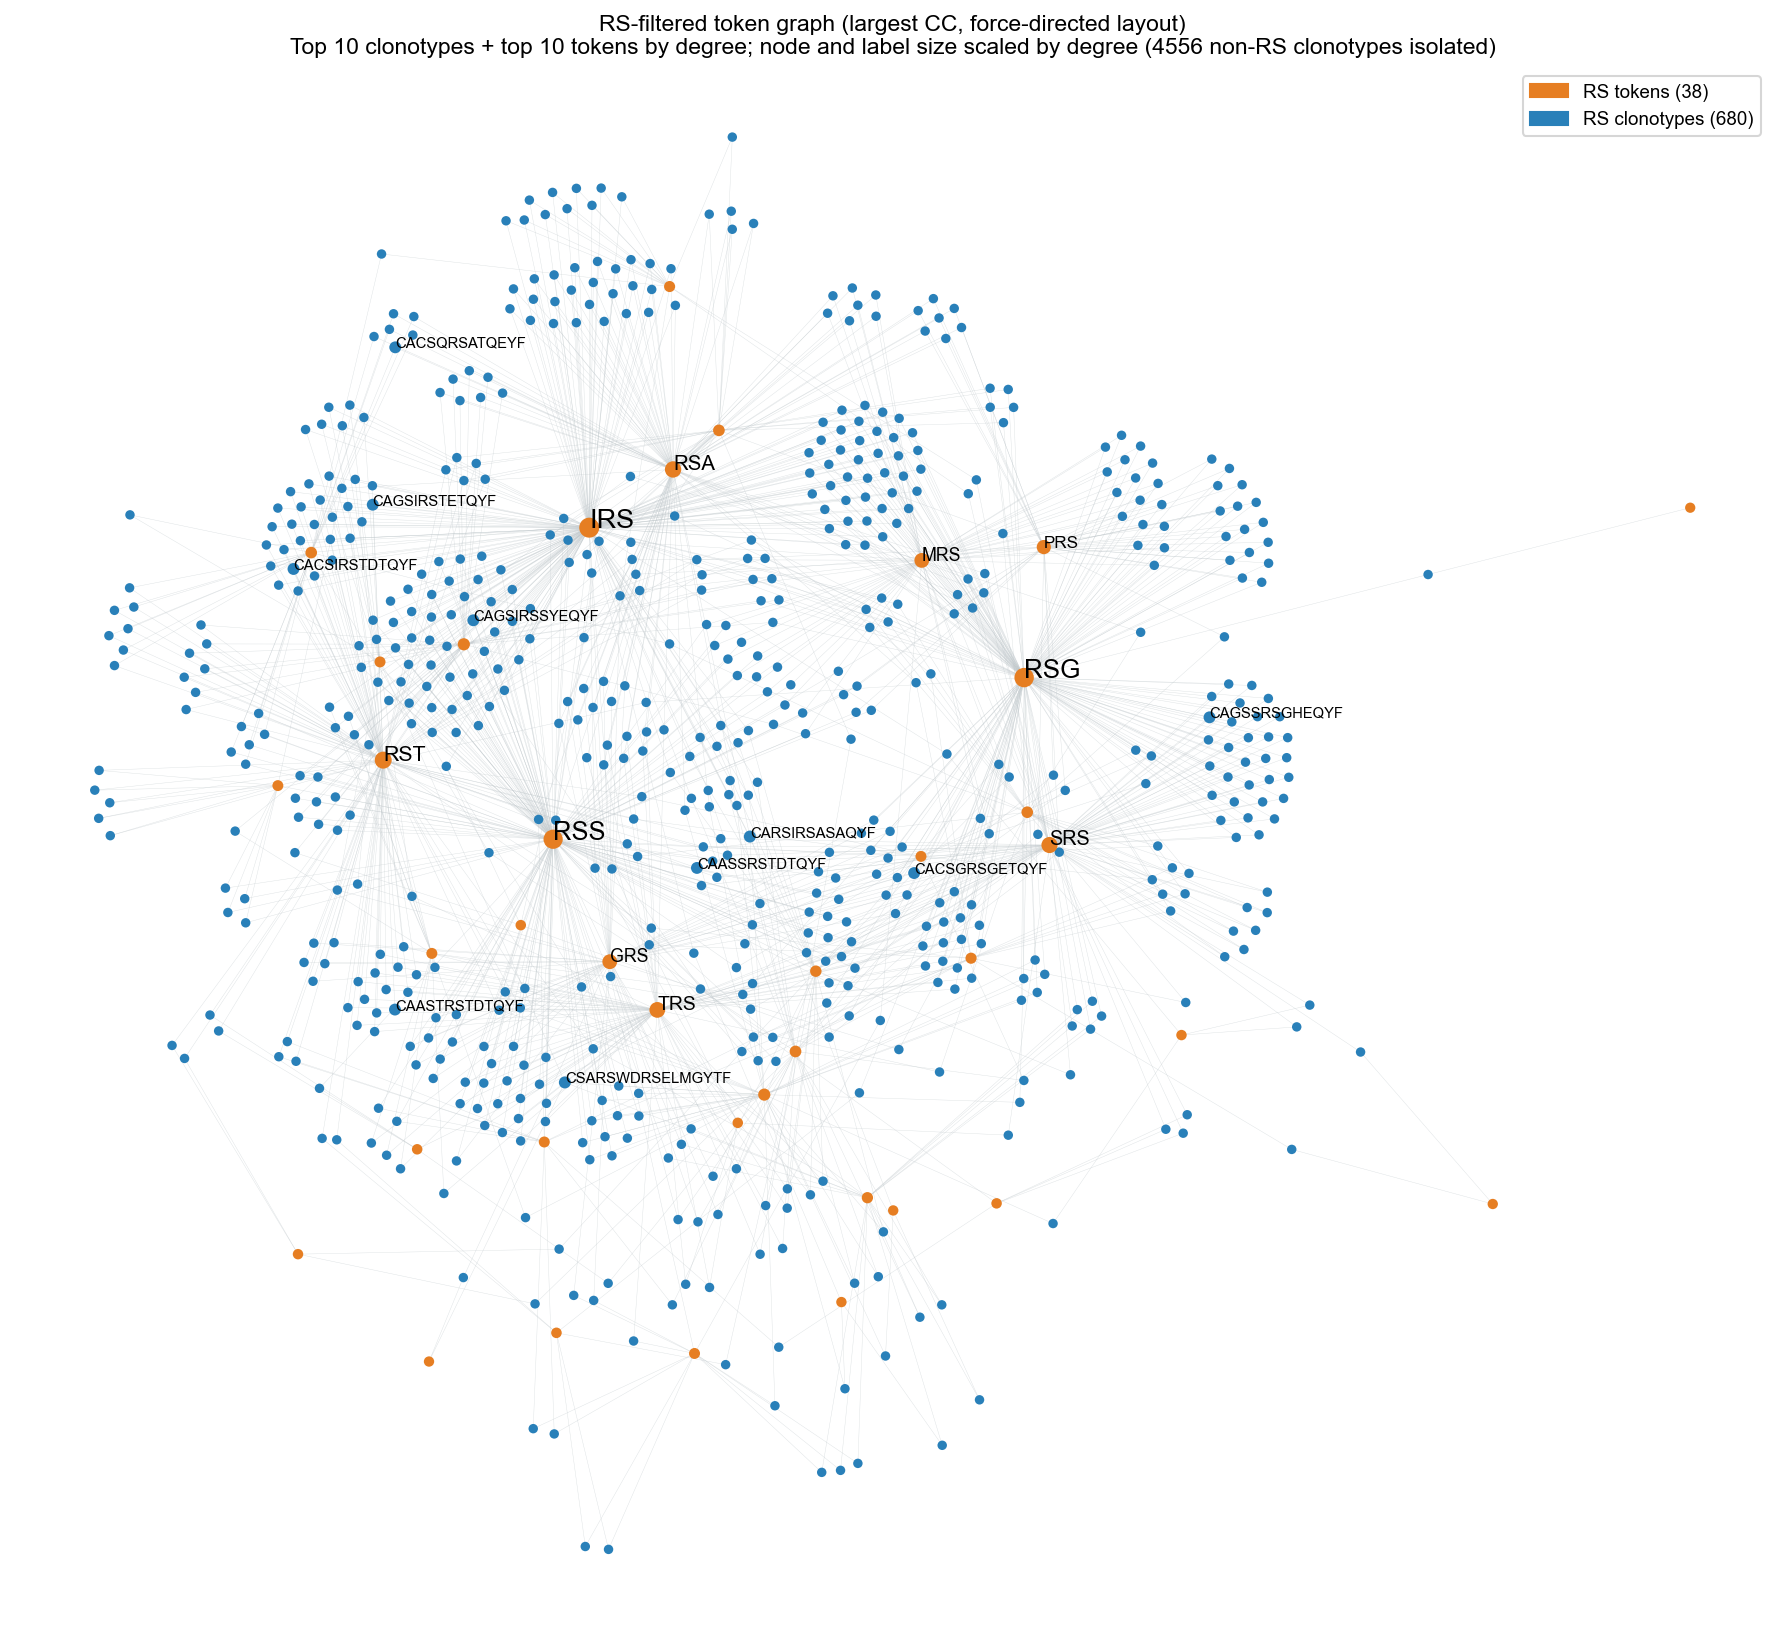
4. RS-filtered force-directed cluster#
After filtering, only RS-bearing clonotypes connected via shared RS tokens remain in the giant CC. All non-RS clonotypes become isolated singletons.
This view again highlights and labels the top 10 clonotypes and top 10 tokens by degree.
[5]:
# Visualize the RS-filtered graph with force-directed layout and the same highlight strategy.
subg_rs = filt_cc
degrees_rs = subg_rs.degree()

top_n = 10
clonotype_idx_rs = [v.index for v in subg_rs.vs if v["node_type"] == "rearrangement"]
token_idx_rs = [v.index for v in subg_rs.vs if v["node_type"] == "kmer"]

ordered_clonotypes_rs = sorted(clonotype_idx_rs, key=lambda i: (-degrees_rs[i], subg_rs.vs[i]["name"]))
ordered_tokens_rs = sorted(token_idx_rs, key=lambda i: (-degrees_rs[i], subg_rs.vs[i]["name"]))

top_clonotype_idx_rs = set(ordered_clonotypes_rs[:top_n])
top_token_idx_rs = set(ordered_tokens_rs[:top_n])
highlight_idx_rs = top_clonotype_idx_rs | top_token_idx_rs

layout_rs = subg_rs.layout("fr")
max_deg_rs = max(1, max(degrees_rs))

rs_colors = []
rs_sizes = []
for v in subg_rs.vs:
    is_token = v["node_type"] == "kmer"
    is_top = v.index in highlight_idx_rs
    rs_colors.append("#e67e22" if is_token else "#2980b9")
    base = (24.0 if is_token else 20.0) + 56.0 * (degrees_rs[v.index] / max_deg_rs)
    rs_sizes.append(base + (12.0 if is_top else 0.0))

n_r_cc = sum(1 for v in subg_rs.vs if v["node_type"] == "rearrangement")
n_k_cc = sum(1 for v in subg_rs.vs if v["node_type"] == "kmer")
n_isolated = len(clonotypes) - n_rs_r

coords_rs = layout_rs.coords
x_rs = [coords_rs[i][0] for i in range(subg_rs.vcount())]
y_rs = [coords_rs[i][1] for i in range(subg_rs.vcount())]

fig, ax = plt.subplots(figsize=(12, 12))
for e in subg_rs.es:
    s, t = e.source, e.target
    ax.plot([x_rs[s], x_rs[t]], [y_rs[s], y_rs[t]], color="#bfc7cb", linewidth=0.2, alpha=0.55, zorder=1)

ax.scatter(
    x_rs,
    y_rs,
    s=rs_sizes,
    c=rs_colors,
    edgecolors="none",
    linewidths=0.0,
    zorder=2,
)

texts_rs = []
for idx in sorted(top_clonotype_idx_rs):
    label_size = 7.0 + 6.0 * (degrees_rs[idx] / max_deg_rs)
    texts_rs.append(ax.text(x_rs[idx], y_rs[idx], subg_rs.vs[idx]["name"], fontsize=label_size, color="black", zorder=3))
for idx in sorted(top_token_idx_rs):
    label_size = 7.0 + 6.0 * (degrees_rs[idx] / max_deg_rs)
    texts_rs.append(ax.text(x_rs[idx], y_rs[idx], subg_rs.vs[idx]["name"], fontsize=label_size, color="black", zorder=3))

try:
    from adjustText import adjust_text

    adjust_text(
        texts_rs,
        x=x_rs,
        y=y_rs,
        ax=ax,
        only_move={"points": "xy", "text": "xy"},
        arrowprops=dict(arrowstyle="-", color="#555555", lw=0.5),
        force_text=0.6,
        force_points=0.3,
    )
except Exception:
    pass

legend_handles = [
    mpatches.Patch(color="#e67e22", label=f"RS tokens ({n_k_cc})"),
    mpatches.Patch(color="#2980b9", label=f"RS clonotypes ({n_r_cc})"),
]
ax.legend(handles=legend_handles, loc="upper right", fontsize=9)
ax.set_title(
    f"RS-filtered token graph (largest CC, force-directed layout)\n"
    f"Top 10 clonotypes + top 10 tokens by degree; node and label size scaled by degree ({n_isolated} non-RS clonotypes isolated)",
    fontsize=11,
)
ax.set_aspect("equal", adjustable="box")
ax.axis("off")
plt.tight_layout()
plt.show()